Section 8. Operation
381
Time
Constants (τ)
Measurement
τ
P
terminal low-level ac mode
TABLE: Low-Level Ac Amplitude and Maximum
Measured Frequency (p. 381)
P
terminal high-frequency mode
1.2
P
terminal switch closure mode
3300
C
terminal high-frequency mode
0.025
C
terminal switch closure mode
0.025
Low-Level Ac Pules Input Ranges
Sine Wave Input
(mV RMS)
Maximum Frequency
(Hz)
20
20
200
200
2000
10,000
5000
20,000
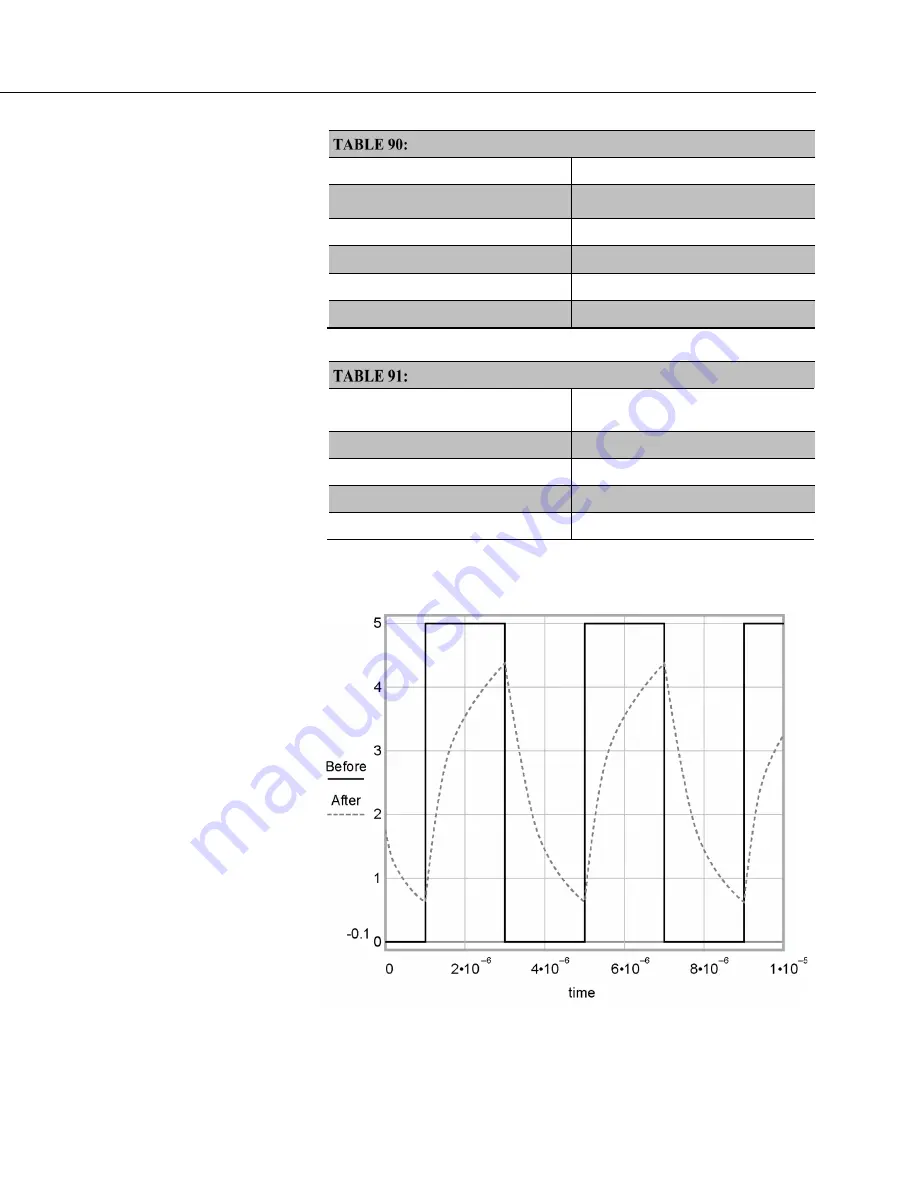
FIGURE 88: Amplitude reduction of pulse count waveform (before and
after 1 µs µs time-constant filter)
Содержание CR800 Series
Страница 2: ......
Страница 4: ......
Страница 6: ......
Страница 32: ......
Страница 34: ......
Страница 54: ......
Страница 92: ......
Страница 190: ...Section 7 Installation 190 FIGURE 40 Running Average Frequency Response FIGURE 41 Running Average Signal Attenuation ...
Страница 310: ......
Страница 446: ...Section 8 Operation 446 8 11 2 Data Display FIGURE 100 CR1000KD Displaying Data ...
Страница 448: ...Section 8 Operation 448 FIGURE 102 CR1000KD Real Time Custom ...
Страница 449: ...Section 8 Operation 449 8 11 2 3 Final Storage Data FIGURE 103 CR1000KD Final Storage Data ...
Страница 450: ...Section 8 Operation 450 8 11 3 Run Stop Program FIGURE 104 CR1000KD Run Stop Program ...
Страница 452: ...Section 8 Operation 452 FIGURE 106 CR1000KD File Edit ...
Страница 456: ......
Страница 462: ......
Страница 523: ...Section 11 Glossary 523 FIGURE 116 Relationships of Accuracy Precision and Resolution ...
Страница 524: ......
Страница 526: ......
Страница 556: ......
Страница 558: ......
Страница 560: ......
Страница 597: ......


