The Code View
ARM DUI 0482K
Copyright © 2010-2012 ARM. All rights reserved.
8-2
ID120712
Non-Confidential
8.1
Code view basics
The Code view helps with the discovery of function-level hot spots. It flattens statistics and
displays them at the source and disassembly levels.
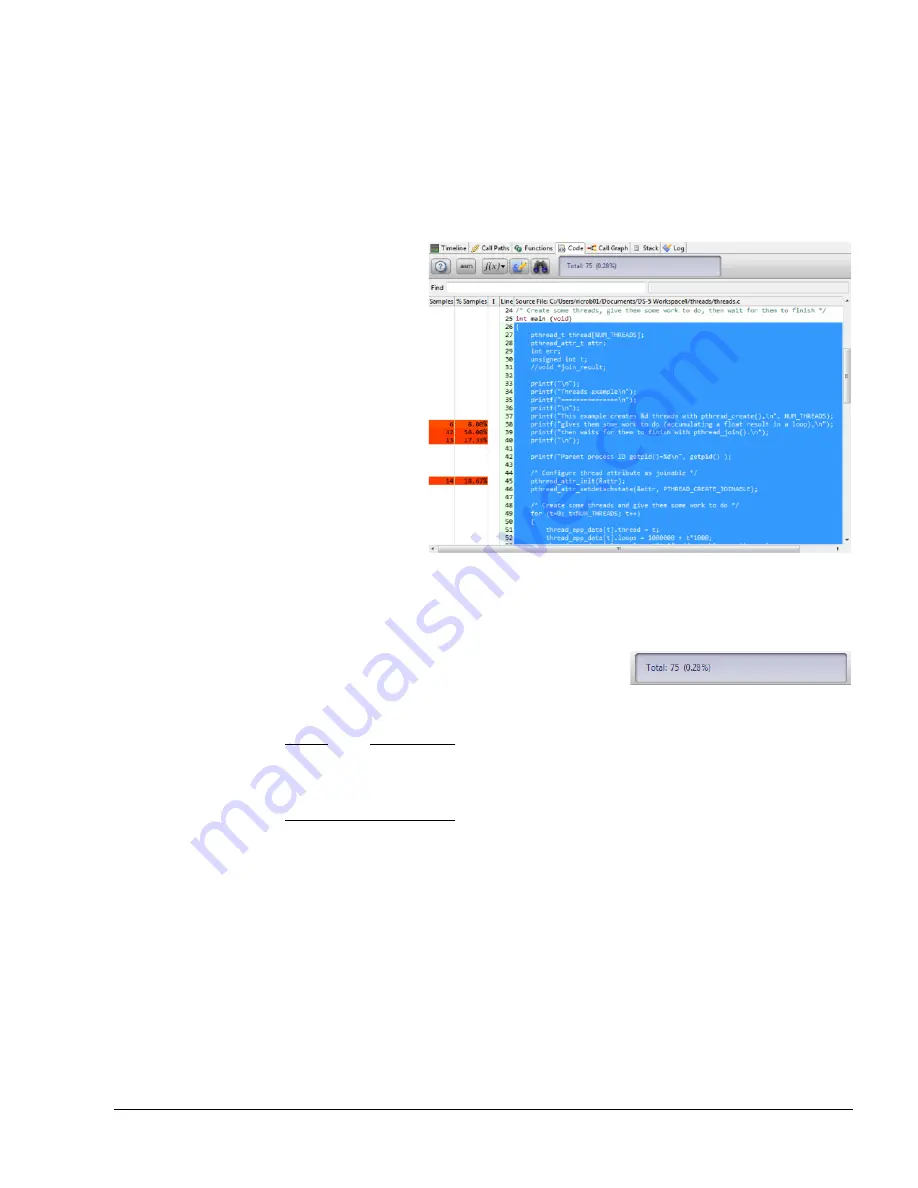
By default, the code view shows the source code next to color-coded statistics. To see both code
and disassembly instructions, click the Disassembly view button to display the Disassembly
view.
Figure 8-1 The Code View
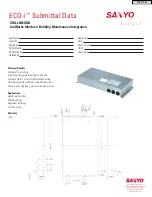
The Code view presents the percentage each source line or disassembly entry contributed to the
total samples collected for the function.
Figure 8-2 The Totals panel
Note
All data in the Code view is dependent on the filtering selection in the Timeline view. If you
have used the caliper controls to filter data in the Timeline view, the data in the Code view
reflects this selection.
8.1.1
Code view selection behavior
Selecting code in the Code view highlights related instructions in the disassembly panel. This
feature ignores coding comments.
Click an instruction in the disassembly panel to select all of the instructions that relate to a single
line of source code. Click on a function label in the disassembly view to select all of the
instructions and lines of code that make up that function.
To select multiple rows, hold down the mouse button and drag it across a range of rows.
Selection behavior available in other applications is also present here. Hold down the shift key
and select the first and last row of the series to select the entire sequence of rows. Hold down
the control key if you want to select additional rows without selecting all of the rows in between.


