The Timeline View
ARM DUI 0482K
Copyright © 2010-2012 ARM. All rights reserved.
6-5
ID120712
Non-Confidential
Turquoise
Second core
Amber
Third core
Purple
Fourth core
White
Fifth core
Red
First cluster
Yellow
Second cluster
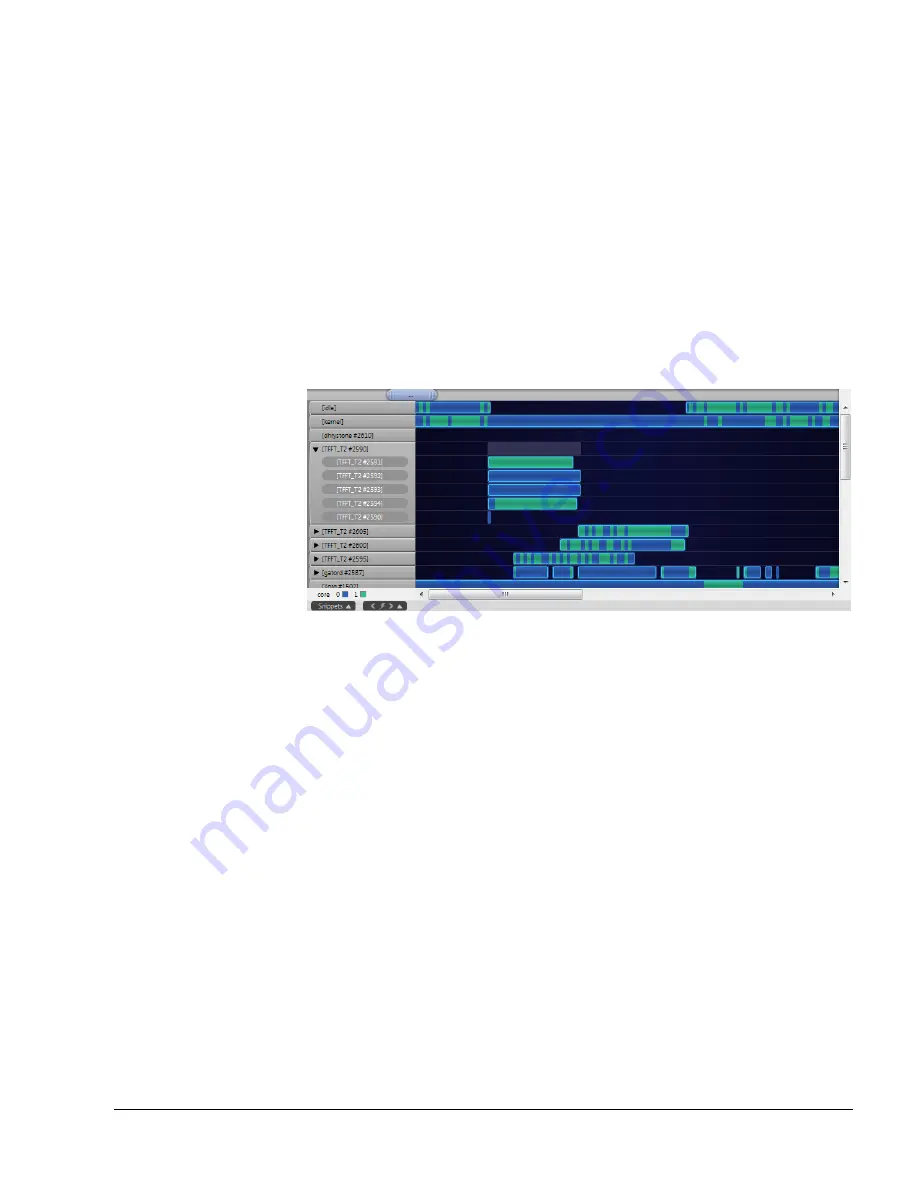
Hovering the mouse cursor over a color-coded bin shows you which core or cluster the color
identifies. There is a key in the bottom left of the Processes section that tells you which color
represents which cluster or core.
X-Ray mode is useful only in SMP systems. All entries in the processes section appear blue in
a single core system report.
Figure 6-7 X-Ray mode with two cores
6.1.5
The process filter
The process filter is located on the right-hand side of the toolbar. Enter a regular expression in
the field to filter the processes in the processes section of the Timeline view. For example, if you
enter a standard string consisting only of letters, the processes section updates to include only
[idle], [kernel], and any processes that contain the entered string. Regular expression strings are
case sensitive unless you include
(?i)
in front of your search expression.
The bar charts in the Timeline view update to display only activity from the remaining
processes.
6.1.6
Bookmarks
You can create bookmarks in the Timeline view, enabling you to label and quickly return to
critical points in the Timeline view. To do so:
1.
Double click in the timeline rule.
2.
Give the new bookmark a title by entering it into the resulting field.


