The Timeline View
ARM DUI 0482K
Copyright © 2010-2012 ARM. All rights reserved.
6-4
ID120712
Non-Confidential
6.1.3
Detail bars
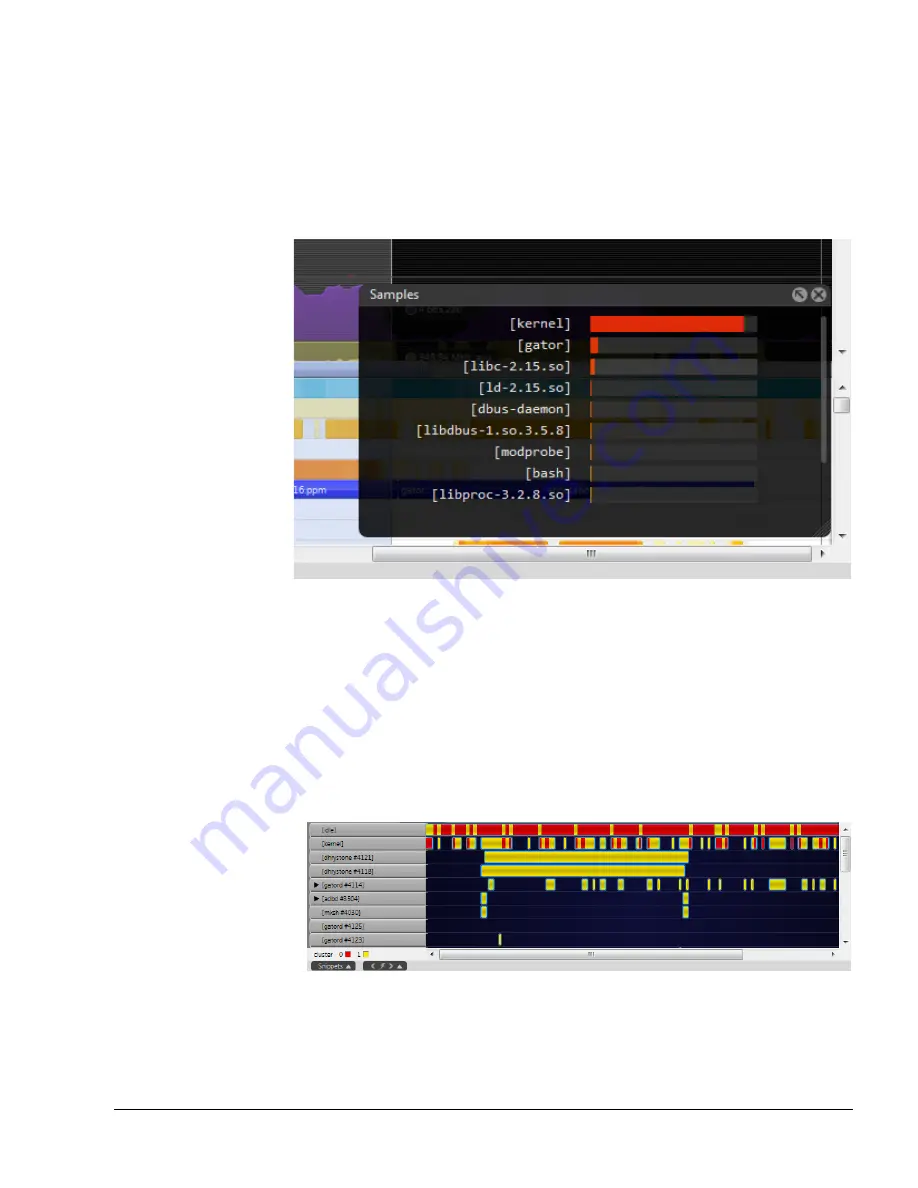
The detail bars show functions with the most samples in the currently selected cross-section.
Selecting a bar jumps you into the relevant context in the Call Paths view. Double-click on the
relevant Capture Data to load more applications and decrease the number of bracketed entries
in this list.
The Samples HUD can be turned on and off using the
Samples HUD
button in the toolbar.
Figure 6-5 Timeline Detail Bar
6.1.4
X-Ray mode
X-Ray mode changes the process trace from an intensity map of time, to a mode that highlights
core or cluster affinity. In this mode, the bars show the mapping of software threads to processor
cores or clusters.
If there are clusters present on a target, the X-Ray mode has several different levels that you can
cycle through. Click the X-Ray button once and the Processes section shows cluster affinity.
Each color in the Processes section represents a cluster of cluster of cores. Click the X-Ray
button again and the Processes section breaks thing down by core.
Figure 6-6 X-Ray mode by cluster
The colors in X-Ray mode are:
Blue
First core


