The Timeline View
ARM DUI 0482K
Copyright © 2010-2012 ARM. All rights reserved.
6-17
ID120712
Non-Confidential
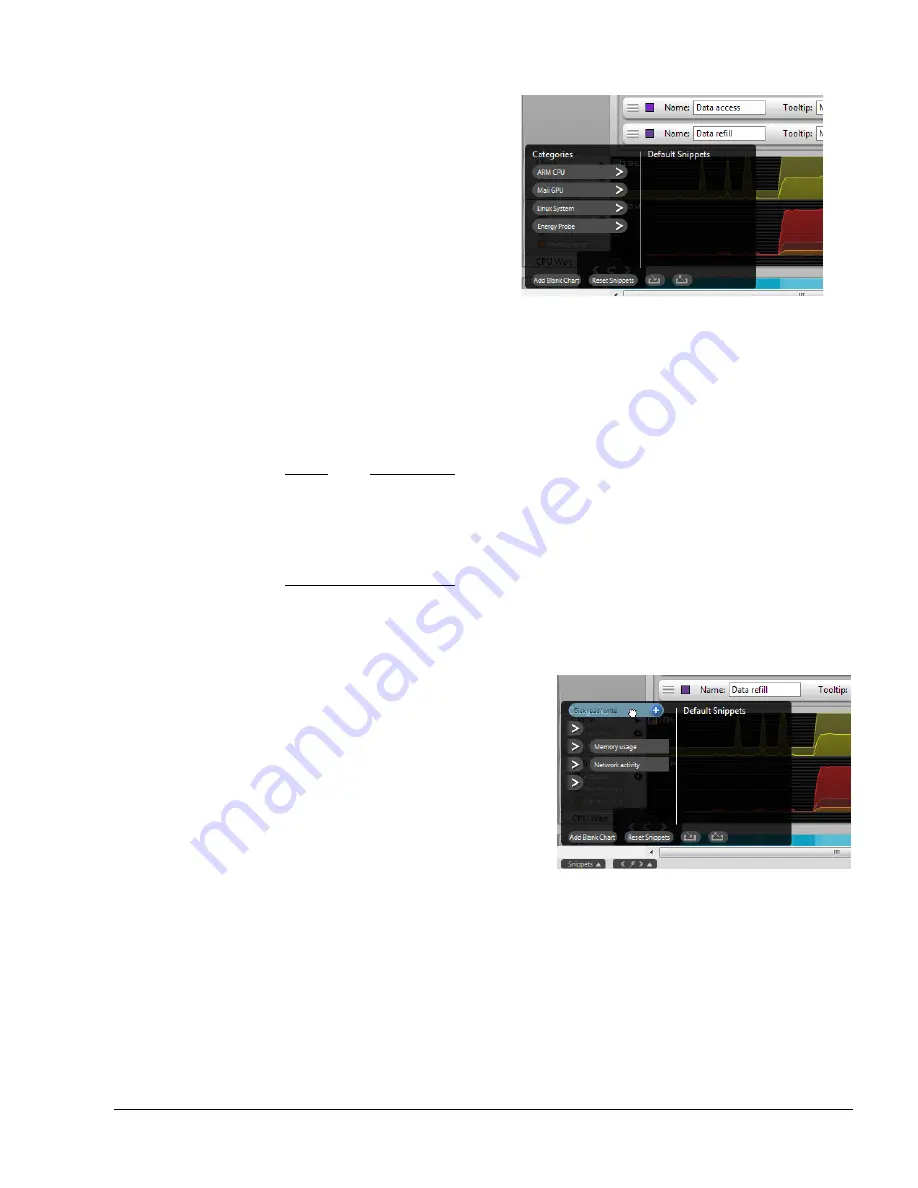
Figure 6-25 The Snippets menu
To add a chart from the saved snippets, follow these steps:
1.
Click any of the available categories to open a list of snippets available in that category.
2.
Click the blue plus symbol to use the snippet to add a chart to the Timeline view.
The selected chart now appears in the Timeline view.
Note
A caution symbol appears next to the snippet if the counters necessary for the chart were not
captured during the capture session. Hover the mouse cursor over a snippet with a caution
symbol to display a tooltip detailing which counters in the snippet were not captured in the
report. Try re-configuring your counters using the Counter Configuration dialog box and run
another capture session to add these charts populated with data.
To move snippets in the Snippets, drag and drop them in the desired location. To re-order a
snippet move it up and down in the list. To move a snippet from one category to another drag
the snippet to the category header and hover for a second.
Figure 6-26 Changing categories
The snippet moves one level up in the hierarchy. Move the snippet over a category and hover to
open that category. Place the snippet in the desired location in that category.
Default Snippets
On the right side of an open Snippets menu is the
Default Snippets
area. Add snippets to this
list to define a default set of charts that the Timeline view uses in every new report. Drag and
drop any snippet from the left side of the Snippets menu to the
Default Snippets
side to create
a new default.


