The Timeline View
ARM DUI 0482K
Copyright © 2010-2012 ARM. All rights reserved.
6-25
ID120712
Non-Confidential
6.6
Visual Annotation in the Timeline view
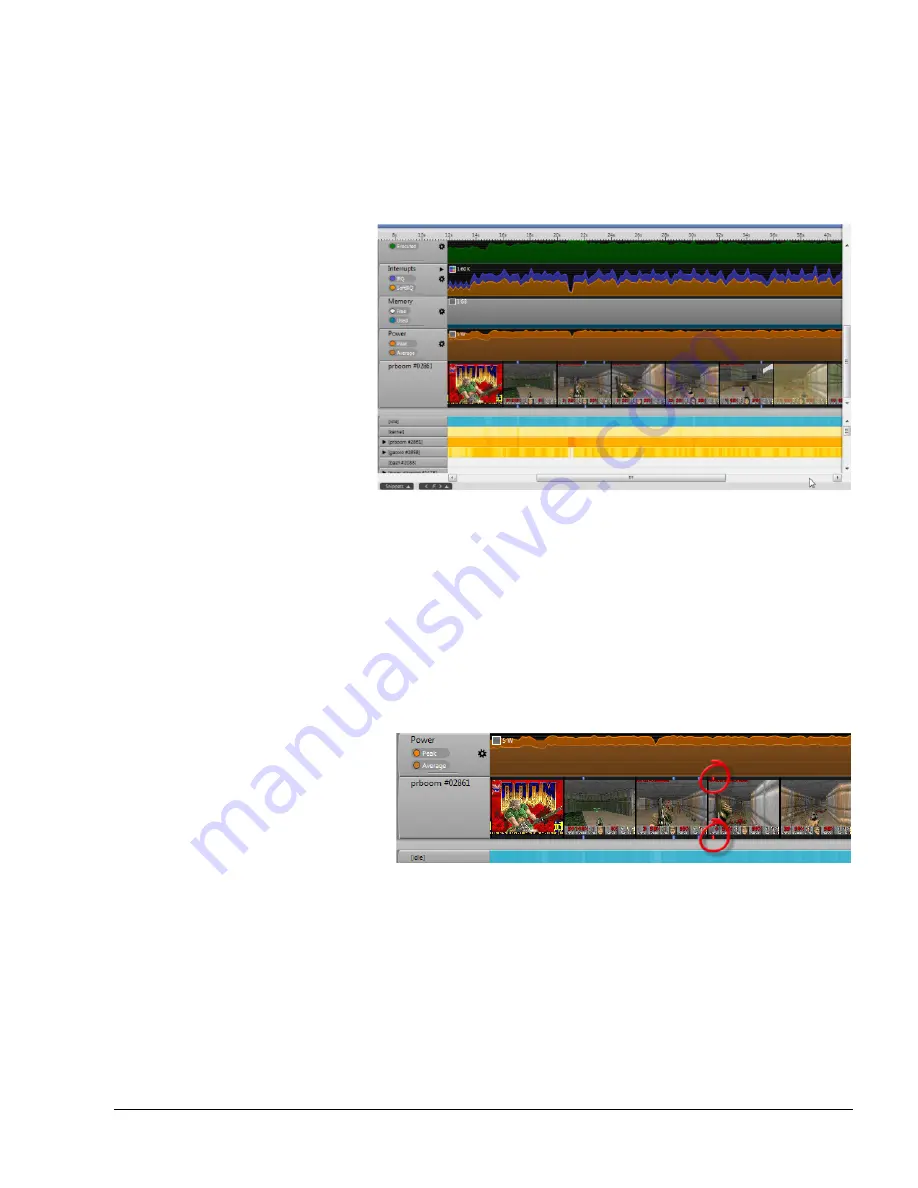
If you used the Visual Annotate feature to add images to the capture data, they appear in the
charts section of the Timeline view.
For instructions on how to use the Visual Annotate feature, see
Adding images to reports using
Figure 6-33 Visual annotation in the Timeline view
Rows in the charts view that contain images can be re-ordered in the same way as the other
charts. But rows containing images have a few unique properties:
•
Hovering your mouse over the images in a visual annotation chart shows you the image
for the current position of the mouse. If there is more than one image in the twenty bin
range covered by each thumbnail pictured in a visual annotation chart, Streamline uses the
first image from the range. Moving the mouse over that thumbnail reveals the other
annotated images in that twenty bin range.
•
Hover over an image in the Timeline view and two red markers appear above and below
the image.
Figure 6-34 Hovering over an image in the Timeline view
The red markers show you in which bin your code produced the current image. Move the
mouse right and left and these markers move each time you move to a new image.
Press
SPACE
while hovering over an image to see a full size version of that image.
•
Blue markers above and below images mark images annotated with text.


