43
increments.
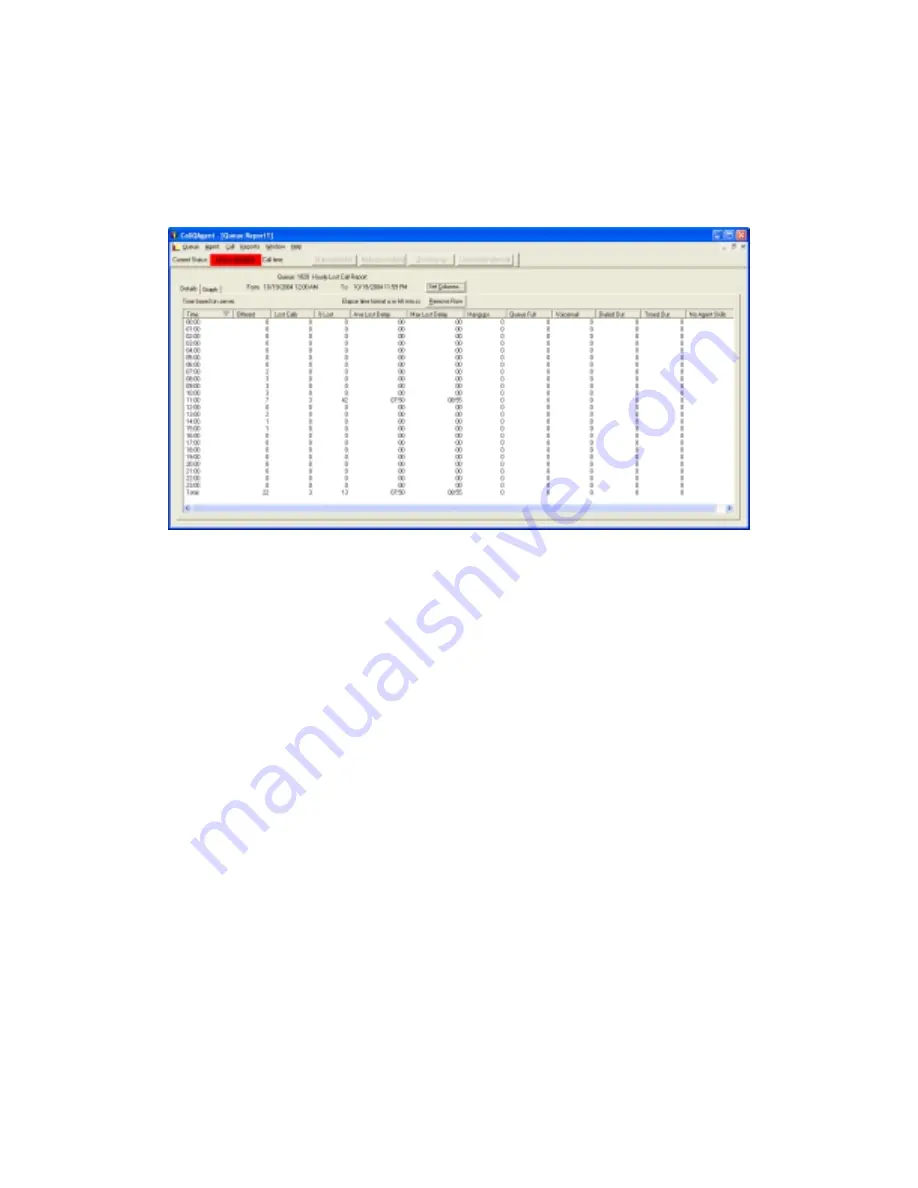
Figure 27
shows the Detail portion of a Lost Calls report, while
Figure 28
shows the graphical portion of the same report. Using the Reports
menu, you can separately save the data underlying the graphical portion of the
report.
Figure 27: Example of the Detail portion of a Lost Calls report
Clicking set columns allows you to add, remove, or re-order columns in the
report.
Clicking the remove rows button allows you to remove the selected row or rows
from the report. You can select a single row or multiple rows by holding down
the shift or ctrl keys. After removing rows, the totals are recalculated
automatically.
For report column header descriptions see Appendix A
Table 1: Call Report Reference Table.


