


6-1
IM WT5000-02EN
Chapter 6 Graph Display
6.1 Setting the Display Format
► “Switching the Displayed Page (Page Scroll)” in the features guide
This section explains operating procedures using the following setup methods.
• Procedure Using the Setup Menu (see chapter 1)
• Procedure Using the Menu Icons (see page iii)
• Procedure Using the Keys (other than SETUP) (see section 1.2 in IM WT5000-03EN)
Procedure Using the Setup Menu
1.
Tap the
Setup
icon
, or press
MENU
under SETUP.
2.
Tap
Computation/Output
tab. A computation and output settings overview screen appears.
Pressing
ESC
closes the overview screen.
Setting the Display Format (Display)
3.
Tap
Display
.
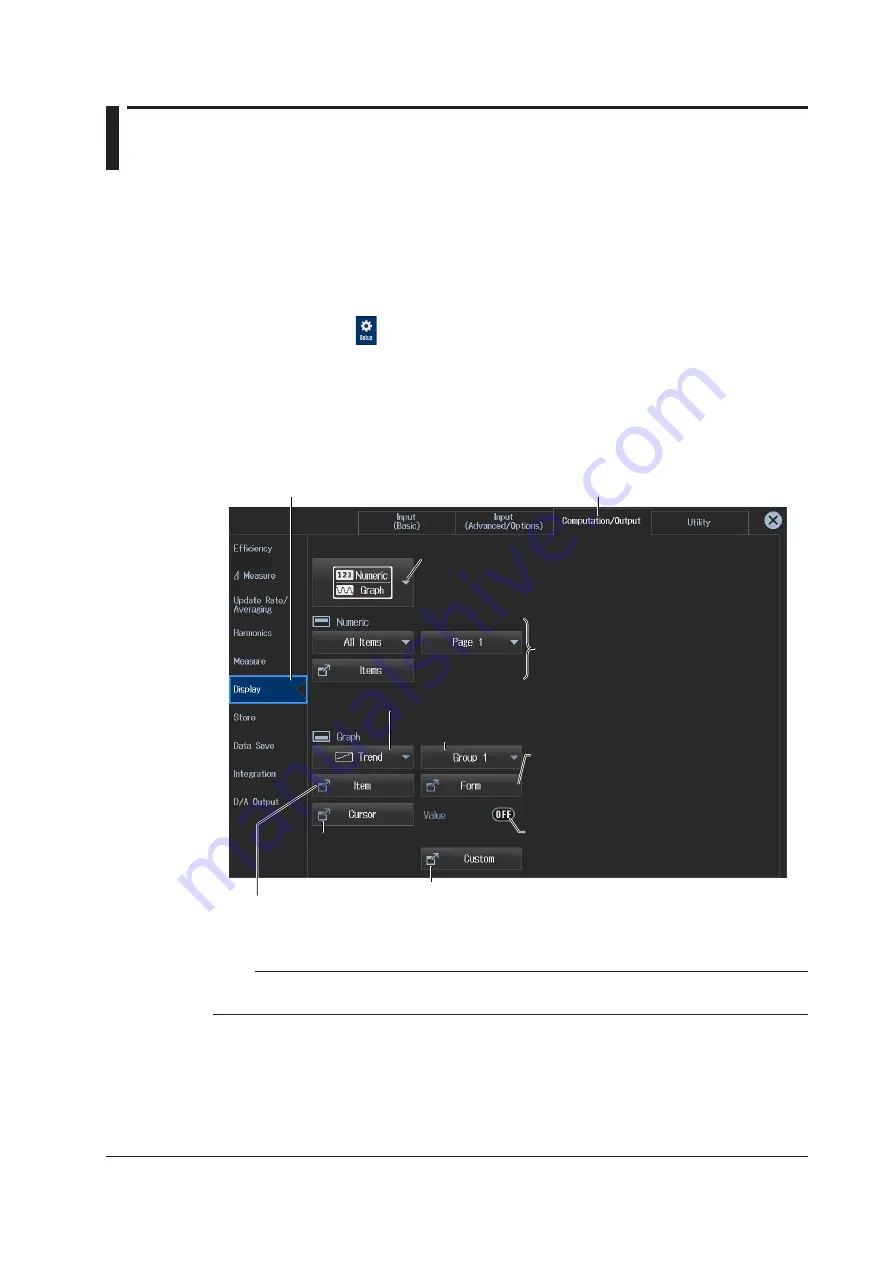
A display format setup screen (Numeric/Graph) appears.
Computation/Output tab
Display button
Graph button: Set the graph display type (Wave, Trend, Bar, Vector).
Switches the displayed group (Group1 to Group4)
Switches the graph group shown in each display format.
Switches the displayed items.
Select the measured values you want to graph. The menu varies depending on the graph
display type. For details, see the graph display explanations in sections 6.2 to 6.5.
Cursor
measurement
Set the display format.
Set the screen divisions, time scale, etc.
The menu varies depending on the graph
display type. For details, see the graph display
explanations in sections 6.2 to 6.5.
Shows the current trend values (see
section 6.3)
You can use this when the graph display type
is Trend.
Selects the screen display
Shows only the numeric or graphic screen in a single screen or
splits the screen into top and bottom halves and shows the
selected screen in each half.
Numeric display (see section 3.1)
Register the custom screen (see section 3.8).
Note
You can also display the computation/output settings overview screen by moving the cursor on the
Computation/Output tab using the arrow keys and then pressing SET.


