background image

Doc. P/N: 

WSP-009-008

Version: V1.3
Issue Date: 

April 2014

www.wassp.com

28 

m

ark

 e

naBle

When this button is enabled all marks will be shown on top 
of the map/chart. When disabled, all marks will be hidden 
from the chart display.

This allows the user to see the seafloor detail which the 
mark may obscure.

t

ext

 B

Ox

These options effect what is shown in the Text Box overlay 
on the main window.


Depth At Cursor

: Shows the depth value at the mouse 

cursor.


Bearing From Vessel

: The angle from the centre of the 

vessel to the mouse cursor.


Distance From Vessel

: Distance from centre of the 

vessel to the mouse cursor.


Latitude, Longitude

: Shows the latitude and longitude 

at the mouse cursor position.


Speed over Ground

: Shows the vessel’s speed relative 

to the seafloor (calculated from GPS position).

p

rOfile

 O

ptiOns

These tools can be used to measure the distance between 
two points on the chart display. The seafloor profile between 
these two points can be viewed in the Profile Window.

a

dd

 m

easure

When the 

Add Measure

 button is clicked and highlighted, 

the next two left mouse clicks will add two measure markers 
on the main window.

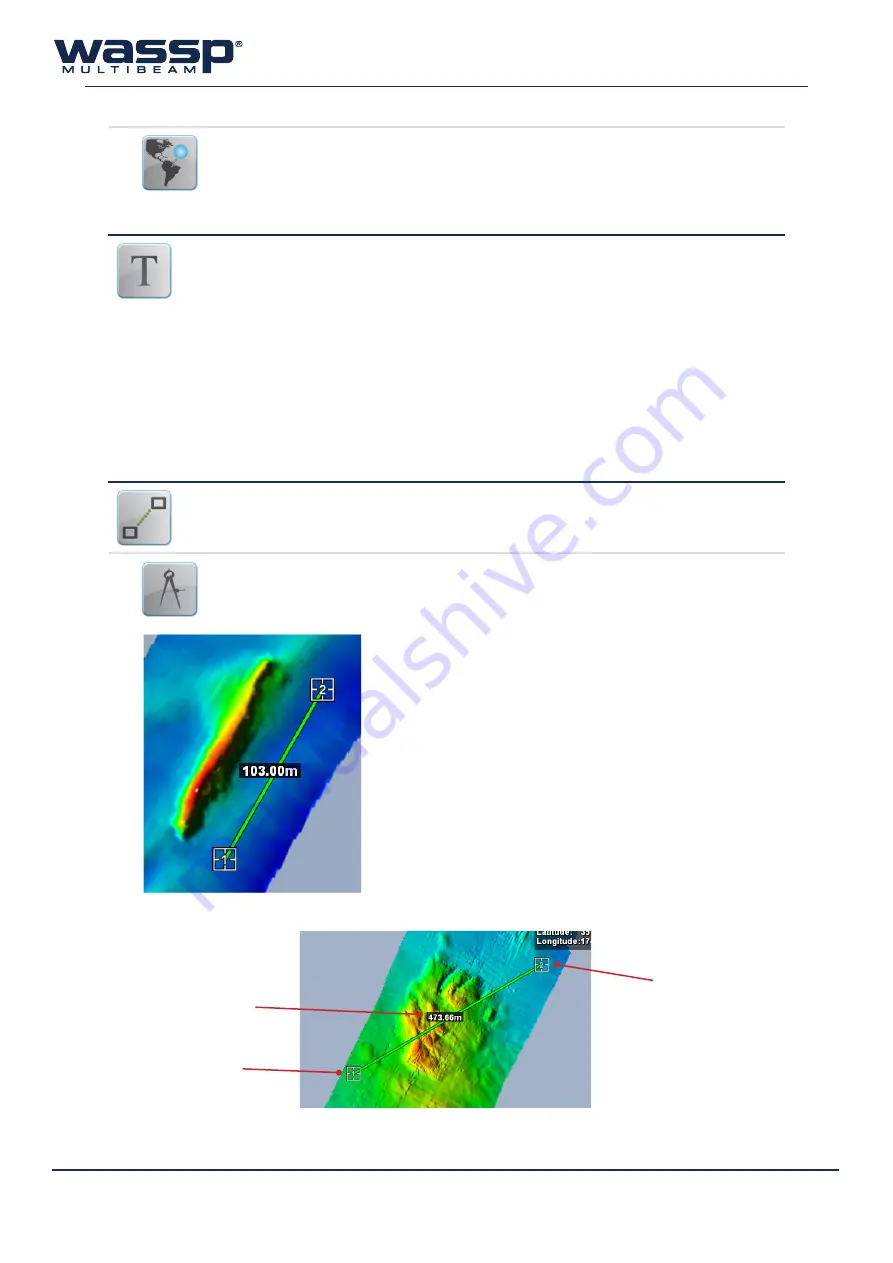
After placing marker #1 the distance between both markers 
will be displayed on the line between them.

When placing marker #2 the line will then be anchored in 
place.

At this point, both markers can be re-located by clicking and 
dragging each marker to a new location.

The purpose of each marker is to provide a measuring tool 
between two points on the map as well as providing a cross-
section of the seafloor depths between the two marks in the 
profile window.

Click the Add Measure button again to remove the current 
markers.

Distance between the 
two measure points

Measure Point #1

Measure Point #2

Figure 11.  Add Measure Tool

Summary of Contents for WMB-3230

Page 1: ...Doc P N WSP 009 008 Version V1 3 Issue Date April 2014 OPERATOR MANUAL WMB 3230 WMB 5230...

Page 2: ...S WITHOUT NOTICE CONTACT WASSP LTD REGARDING COPYING OR REPRODUCING THIS MANUAL Disclaimer WASSP LTD RESERVES THE RIGHT TO CHANGE THIS MANUAL WITHOUT NOTICE ALTHOUGH WASSP LTD HAS MADE EVERY EFFORT TO...

Page 3: ...y occur if the power is left ON Do not open equipment covers unless you are totally familiar with the system s electrical circuits Make sure all safety precautions for electrical equipment are taken w...

Page 4: ...ndicators 6 2 4 Mode Button 6 2 5 Gain Control 7 2 6 Range Control 7 2 7 Layout Selection 7 2 8 Power Level Control 7 2 9 Snapshots Button 8 2 10 Mapping Options 8 2 11 Utility Panel Button 8 2 12 Clo...

Page 5: ...35 6 7 Raw Signal Data 37 6 7 1 IQ Raw Data Tab 37 6 7 2 Sensor Data Tab 39 6 8 IQ Bars 39 6 9 Database Manager 40 6 9 1 Adding a new database 41 6 9 2 Database Management 42 6 9 3 Database File Path...

Page 6: ...DE button or run a replay demo file I get no picture on the display Why 58 9 7 When I press the MODE button the button goes red and a number on it counts up but there is no activ ity on the WASSP disp...

Page 7: ...for complete knowledge of the world beneath with the ability to view both real time and previously recorded maps from any part of the globe in 2D and 3D Depth and backscatter colours can be dynamicall...

Page 8: ...n sized to save recording space Digital signal processing DSP Using DSP technology the WMB X230 can provide an indication of changes in seafloor hardness ideal for scalloping crayfishing and trawling...

Page 9: ...X230 WMB X230 1 Transducer Cable Transducer Hull Position Time RS232 NMEA0183 Pitch Roll Heave RS232 NMEA0183 Gland Hull GPS Power Cable wassp Figure 1 Overview of a complete WASSP system 1 4 System...

Page 10: ...Startup Your WASSP Processor will automatically run the WMB X230 software as it is powered up Alternatively the software can be run from the Windows Start Menu Start All Programs WASSP or Desktop Fig...

Page 11: ...ach of the buttons or controls on the Main Menu are talked about in some detail over the following section Buttons requiring a more detailed explanation have their own chapter Device Connection Indica...

Page 12: ...s indicator will be green see page 62 of the Installation Manual for further information BTxR Transceiver When the BTxR is ON and connected this indicator will be green 2 4 Mode Button This button is...

Page 13: ...cycle through preset display layout arrangements Each of the Sonar displays and Chart displays can be configured in different arrangements and those arrangements can be cycled through Left click to cy...

Page 14: ...by the WASSP sonar See 6 9 Database Manager on page 41 for more information on recording databases This button toggles 3D fish marks recording for the Chart displays When enabled 3D fish mark informat...

Page 15: ...the WASSP software 3 1 Sonar Display The sonar display shows the water column and seafloor profile below the transducer This represents a sonar view of the water column and seafloor as seen from behi...

Page 16: ...e position angle and width of each beam will be clearly visible A RED mask for the port beam grey mask for the centre beam and GREEN mask for the starboard beam Normalise Enable this to normalise the...

Page 17: ...Starboard Beam Triple Beam Vertical Port Beam Starboard Beam Middle Beam 3 2 1 Configuration The Single Triple Beam Display can be configured by clicking the in the top left corner of the display wind...

Page 18: ...nd under this menu Bottom Lock This enables a traditional bottom lock mode where the changes in bottom depth are ignored and the bottom is drawn flat Fish and other echoes are shown relative to this f...

Page 19: ...he screen Triple Beam This button enables the Triple Beam display Triple Beam orientation can be changed between Horizontal and Vertical in the System Tab of the System Configuration Utility see 7 1 4...

Page 20: ...e picture shows features on the seafloor Objects such as rocks appear as bright white marks followed by a shadow Harder ground gives strong returns lighter on the grey scale while a patch of mud or ke...

Page 21: ...er allows you to increase or decrease the brightness scale of the Sidescan Display The number in the white box is the Sidescan Gain Threshold Limit Adjusting this value will effectively change the con...

Page 22: ...start From Range If the user has set detections to All Targets in Ping see System on page 46 then the From Seafloor setting becomes From Range In this case users are generally working in deep water wi...

Page 23: ...shown on the Histogram if they are below the Target Threshold Current Detection Depth settings Detection Mode selection Presets are either Mode 1 or Mode 2 with varying descrimination settings Show So...

Page 24: ...o the chart display uses the functions of a standard mouse or touch screen Left Mouse Button Select menu interface with map click and drag to pan around Mouse Wheel Zoom In Out Menu Button See Configu...

Page 25: ...Chart tab see page 52 There are two angled arrow buttons The top one sets the Red colour depth The bottom one sets the Blue colour depth Both buttons can be clicked on with the left mouse button and...

Page 26: ...adjusted by the Light Level slider Hardness Tab The Hardness Backscatter Tab shown here allows you to set the backscatter colour range Correct setting of these controls will greatly assist in viewing...

Page 27: ...Colour Depth Colour by depth allows the user to show the seafloor data coloured between the selected values on the configuration windows By changing this range of colours you can more easily visualise...

Page 28: ...is used to display the seafloor using only one colour This colour can be changed from the System Config System Page The seafloor image will still be lit from the selected lighting direction This mode...

Page 29: ...the changes in seafloor even when the seafloor is very flat This gives the user a good indication of where the rocky hard areas and the soft muddy areas are Show 2D Fish Show 2D Fish will overlay the...

Page 30: ...rval is setup in the Chart Tab of the System Configuration Utility under Bathymetry heading See 7 4 Chart Tab on page 52 for more information Vessel This menu contains settings pertaining to how the v...

Page 31: ...rrent heading Heading Up When this button is enabled the map rotates around the vessel The vessel icon will always point directly up the screen Show Vessel Track When this button is enabled the vessel...

Page 32: ...ve a yellow circle when it is highlighted Left clicking will bring up the Mark Setup window Configuring the mark is optional Press to select Mark Colour Press to select Mark Type Enter Mark Name Enter...

Page 33: ...d a bookmark will be placed at the cursor position when the operator next presses the left mouse button The Bookmarks Menu can be found inside the Database Menu on the System Configuration Utility pan...

Page 34: ...GPS position Profile Options These tools can be used to measure the distance between two points on the chart display The seafloor profile between these two points can be viewed in the Profile Window A...

Page 35: ...een the shallowest and deepest points on the profile Shallowest profile reading Deepest profile reading Distance along profile from measure point 1 to cursor Close the Profile Window Figure 12 Profile...

Page 36: ...ts 2D master See 3D Master on page 29 for more details The interface to the 3D display uses the functions of a standard mouse or touch screen Left Mouse Button Select menu click and drag rotating inte...

Page 37: ...tical horizontal display ratio of 4 1 so the 3D display and all contained features are drawn four times as high as they would appear under the water Options This menu contains options for controlling...

Page 38: ...ch can be stored Once this maximum has been reached for a geographical area the oldest fish marks are removed If the Show Depth at Cursor option is enabled on the Chart tab see page page 53 moving the...

Page 39: ...lays until it is closed 6 1 Overview Each of the functions that the Utility Panel contains is talked about in more detail over the following section Refer to the links below Figure 15 Utility Panel Ov...

Page 40: ...this check box applies the current set tings of the program running on your WASSP Processor to the replay file NOTE Once the check box is selected files opened after the check box is selected use the...

Page 41: ...ng process used to remove all signals below a threshold level from the sonar and fish finder displays The control sets the threshold for the minimum signal level that will be displayed on these displa...

Page 42: ...update all previous fish finder history The Noise Filter is designed to helping clean up the Sonar and Fish Finder Views and to prevent low level noise amplifying up with TVG and standard Gain to conf...

Page 43: ...ally detects the key pulse device ping rate to optimise the choice between Rx Blanking above and Slave Mode above This option finds a balance between the least interference and best ping rate Transfer...

Page 44: ...annel Signal Function on page 41 of the Installation Manual for the relevant commissioning procedure 6 7 1 IQ Raw Data Tab The user has the ability to zoom in on an area of the display by clicking and...

Page 45: ...where the WASSP is operating in Slave Mode The first key pulse visible has triggered the WASSP system to ping and collect data During the data collection a second key pulse was detected but this did n...

Page 46: ...nd Date are also represented on this display If vital sensor information is missing the Status will read RED and will show what sensor is required 6 8 IQ Bars This display shows the IQ and magnitude o...

Page 47: ...writing on a subsequent visit The Database Manager provides an ability to select both a Viewing and a Recording database The information displayed on the chart display is always taken from the Viewin...

Page 48: ...p Grid Size This is used to set the resolution of the seafloor maps The smaller the grid size the greater the resolution and accuracy of the seafloor data 0 25 m applicable for the first 40m is the hi...

Page 49: ...ap Grid Size of each database is shown in the window The space saved by carrying out the database reduction is indicated below the database list Click the Convert to 0 5m Gridding button to carry out...

Page 50: ...in reduced lighting conditions the user may find it more comfortable to use Night Mode Night Mode darkens the entire user interface so that the user is able to use the program in a darkened wheelhouse...

Page 51: ...to save and load complete sets of configuration settings including all of the settings previously discussed This allows different configurations to be switched between in a few seconds Active Configur...

Page 52: ...display The gain of signals received above the seafloor line remains unchanged See Figure 26 for some examples Water Column Targets Only targets above seafloor Targets recorded are those that are posi...

Page 53: ...be enabled disabled with this checkbox When enabled positioning the cursor over buttons on the Main Menu and the Utility Panel will reveal the operation of that button Triple Beam Scale By default the...

Page 54: ...corded AND a motion sensor is configured This settings enables the system to compensate for relative heave at different points on the vessel generated by the vessel pitching and rolling 7 2 3 Sound Sp...

Page 55: ...changed Motion Delay The motion delay value is displayed for information only and cannot be changed The value is determined by the type of motion sensor selected in the General Tab of the Ship Setup...

Page 56: ...other power levels have been changed clicking Defaults will reset the power level Automatic Power By Signal Manual Power Automatic Power By Depth Figure 29 Ship Setup Power Tab Absorption Loss As sou...

Page 57: ...and wanes resulting in inconsistencies in seafloor mapping Disable Tides should be selected if you are working on a lake Enter the local time difference in hours from Coordinated Universal Time UTC in...

Page 58: ...ng SET Anchorage Areas Areas where vessels can anchor and shows marinas jetties and wharfs Cables Overlays locations of underwater cables Depth Contours Shows the depth contour lines from the chart ca...

Page 59: ...ow thick the vessel track is drawn Distance Time Depending on the Vessel Track Mode setting these settings influence how far apart each tracking point is drawn Colour This changes the colour of the ve...

Page 60: ...y Vertical Split Horizontal Split 3 Way Split 1 2 To Configure the Display Layouts 1 Select the preset you want to configure 2 Select what display layout you want The available options can be cycled t...

Page 61: ...not saved and the Sonar display will be blank when viewing a snapshot The snapshot does not replay like a demo file When selected and loaded into the program it remains static All menu options are st...

Page 62: ...ugged into the WASSP Processor s USB port and click Retry If this doesn t work remove the dongle and try plugging it in again STATUS POWER You can click Cancel and run a demo file from the Utility Pan...

Page 63: ...s Click the MODE button to set the BTxR to standby Click the Exit button on the main menu The Exit System box appears Click OK All files opened by the system are closed automatically and the program s...

Page 64: ...Why do gaps appear between the swath footprints on the charting displays 59 5 The system has stopped transmitting without operator intervention Why 60 6 When I click the MODE button or run a replay d...

Page 65: ...while in this mode If any zooming is done with the wheel mouse then automatic range control will be disabled again until you once again double click on the appropriate view 9 3 Why is no seafloor pro...

Page 66: ...ning look for the icon on the Start Bar at the bottom of your monitor and was running when you started WASSP If not restart WASSP after running the Transfer Task application 9 8 What does the error me...

Page 67: ...he system is configured to compensate for Pitch and there has been a gap of multiple pings where there was no Pitch data received Check the Motion Sensor configuration in WASSP Also check the Serial P...

Page 68: ...eading Too much power This is the most common cause of problems When there is too much acoustic energy in signals returned from the seafloor they may distort Distortion of the signals will cause ambig...

Page 69: ...e boat and is within the dimen sions of the ship then this signal is probably a reflection off your own ship This will make it hard to detect fish at this depth but otherwise shouldn t affect the perf...

Page 70: ...time This function also allows wrecks to show on the contour display as these are often similar in density to fish schools GPS Position If there is no position input the WASSP system will not output d...

Page 71: ...ing Remember too that if the vessel is operating in a high sea state your motion sensor may not be able to fully compensate for the vessel s movement Check roll information is being received Open the...

Page 72: ...FAQ page 60 Ensure that the Transducer has not been disconnected from the BTxR both the receiver cables and the transmit cables need to be connected in order for the WASSP system to operate If proble...

Page 73: ...e BTxR indicator is red ensure the BTxR is powered ON and connected to the correct network port of the WASSP Processor via the supplied ethernet cable see APPENDIX A Specific WASSP Processor Informati...

Page 74: ...witch to the Sonar display 9 The Range Control might have locked on to an incorrect depth Adjust the Range Control dial so that the returned signal from the seafloor can be seen on the Sonar display D...

Page 75: ...Doc P N WSP 009 008 Version V1 3 Issue Date April 2014 www wassp com Operator Manual 69 THIS PAGE HAS BEEN LEFT INTENTIONALLY BLANK...

Page 76: ...TSS1 PSXN PASHR HDT HDG VTG RMC GGA GGL ZDA PFEC Gpatt PFEC Gphve Key Pulse Outputs Olex Sodena MaxSea Key Pulse Recording Realtime bathymetry mapping Raw Data XYZ ASCII Power Supply BTxR WASSP Proce...

Reviews: