Doc. P/N:
WSP-009-008
Version: V1.3
Issue Date:
April 2014
14
3.3
Sidescan Display
The sidescan display is another display type for viewing information generated from sonar data
received by the system. The display is drawn on the screen as a waterfall – the newest information
appears at the top of the screen, while the oldest falls off the bottom of the screen. This is similar to
the way the Single / Triple Beam Display operates, except that in their case, the new data appears on
the right and the old data disappears off the left of the display.
The left side of the Sidescan Display shows the signals received from the port side while the right
shows signals received from the starboard side. By default, the sidescan view starts at the centre of
the vessel and works its way out to port and starboard.
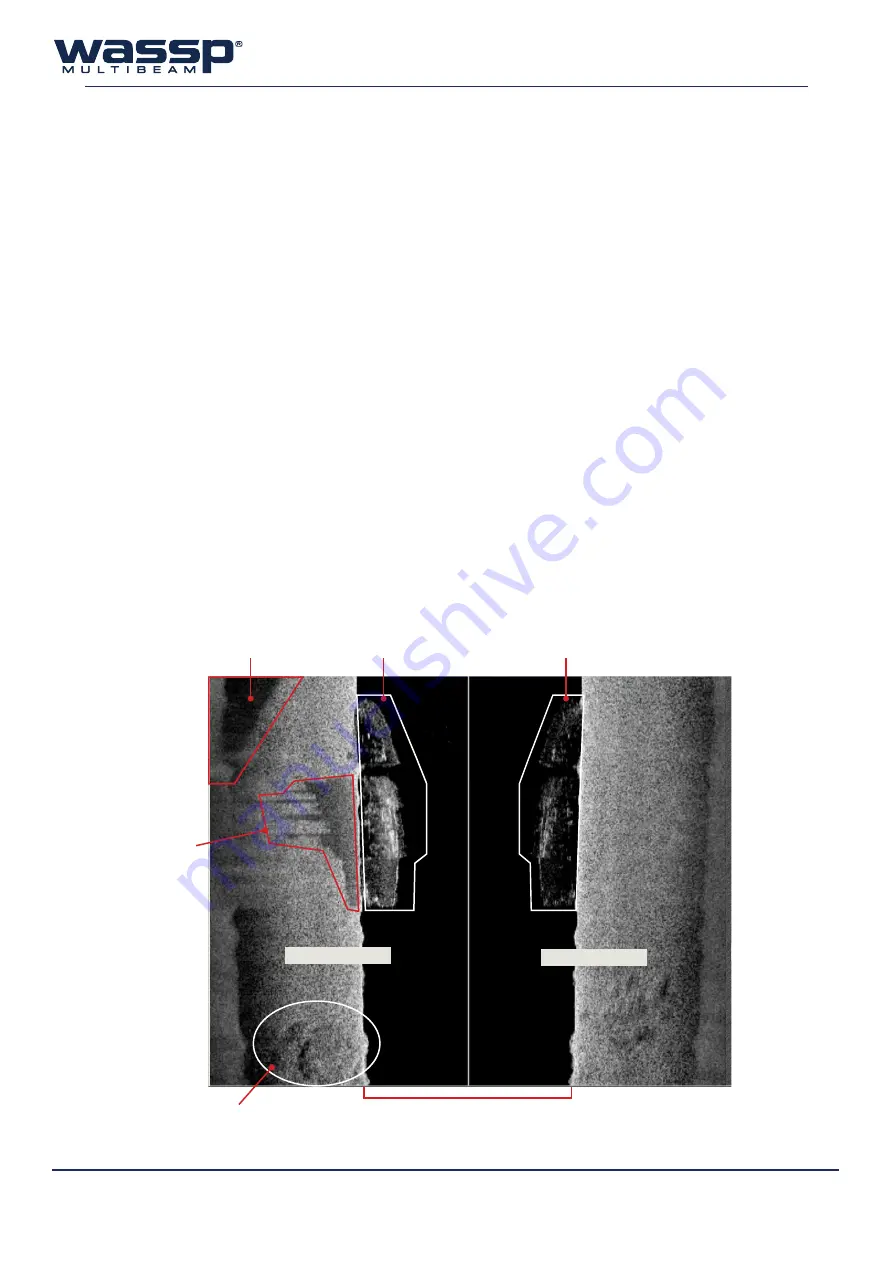
As the sidescan image moves further out along the seafloor, the picture shows features on the seafloor.
Objects such as rocks appear as bright white marks followed by a shadow. Harder ground gives strong
returns (lighter on the grey scale), while a patch of mud or kelp causes a dark patch/shadow to appear.
The primary advantage of the sidescan view over the other views is in locating and identifying objects
on the seafloor off to each side of the vessel. Some structures such as a shipwreck may appear like a
large fish school on the sonar view and thus not appear as an object on the other acoustic or chart
displays. Figure 7 shows how a wreck sitting on the seafloor can be distinguished as a clearly shaped
structure by using the Sidescan Display, allowing the user to interpret the sonar information from a
different viewpoint.
Due to the nature of the origin of the data, any signals of significant strength register as a faint mirror
on the opposite side of the display.
Area of soft ground
Indication of ship wreck
Reflection of ship wreck
Rocky area
Shadow
of wreck
Water column
Figure 7.
Sidescan Display
Port Side
Starboard Side


