Exo x6a Operations Manual
revision 1
1st September 2013
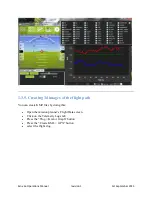
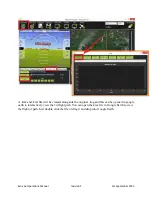
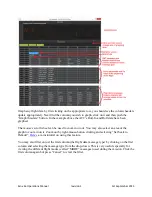
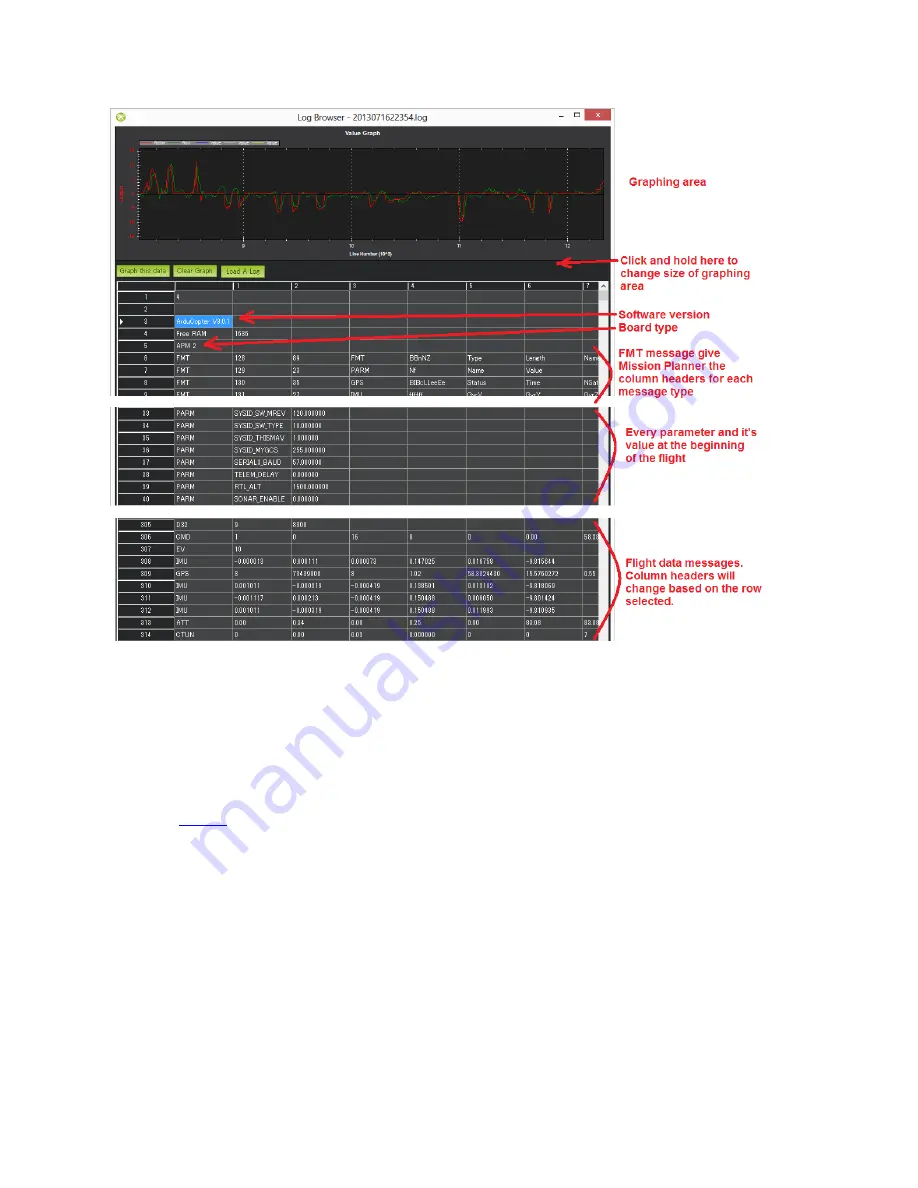
Graph any flight data by first clicking on the appropriate row, you should see the column headers
update appropriately. Next find the column you wish to graph, click on it and then push the
“Graph this data” button. In the example above the ATT‟s Roll-In and Roll data have been
graphed.
The mouse‟s scroll wheel can be used to zoom in or out. You may also select an area of the
graph to zoom in on it. Zoom out by right-mouse-button clicking and selecting “Set Scale to
Default”.
a mini tutorial on using this feature.
You may also filter on just the first column (the flight data message type) by clicking on the first
column and selecting the message type from the drop-down. This is very useful especially for
viewing the different flight modes (called “MODE” messages) used during the mission. Click the
first column again but press “Cancel” to clear the filter.

