


www.trilithic.com
Page IV-158
180 DSP Operation Manual
Signal Level Meter
Function Menu Options
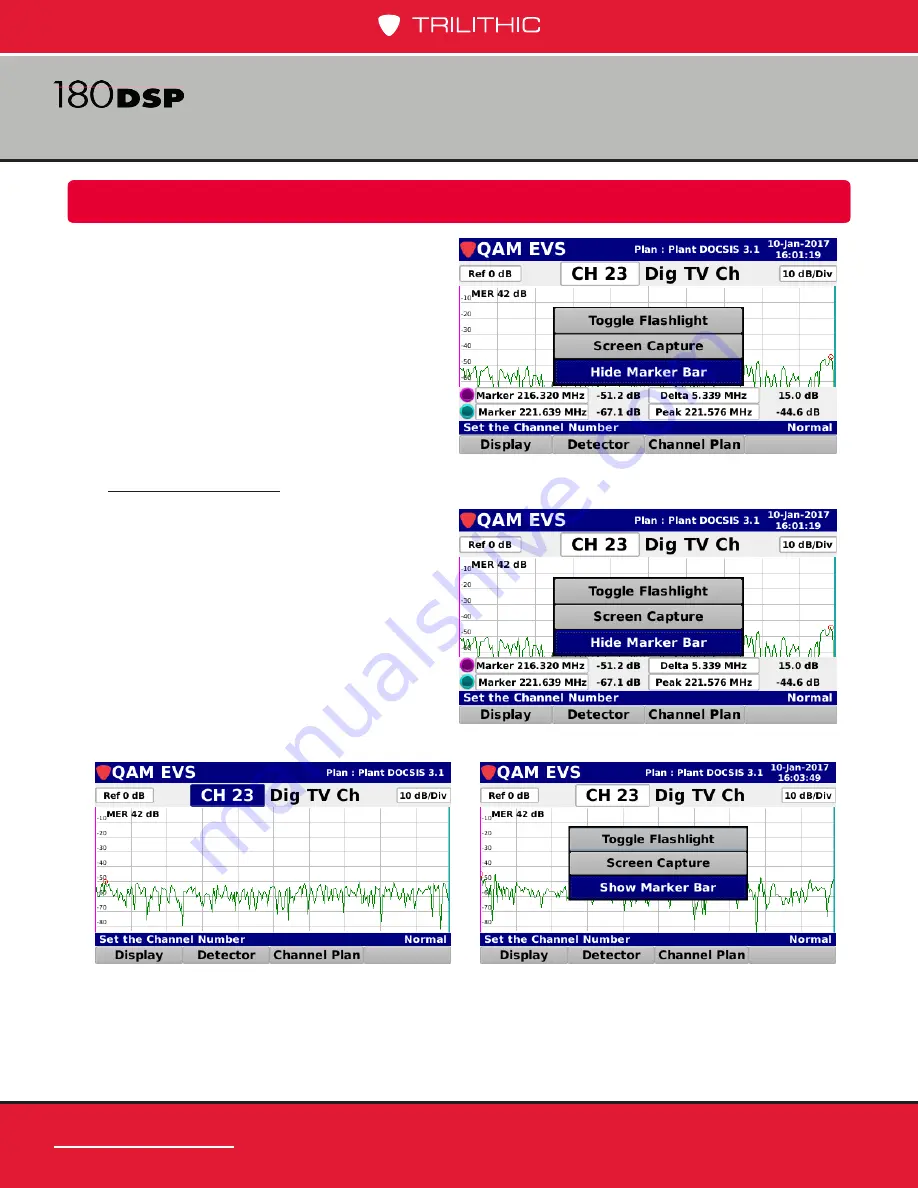
Additional functions can be accessed from
within the
QAM EVS
screen by pressing the
Function
button. The
Function
menu will
be displayed as shown in the image to the
right and includes the following functions
specifically for the
QAM EVS
screen.
Hide Marker Bar
Select the
Hide Marker Bar
button from
the
Function
menu
to hide the marker bar
at the bottom of the screen and expand
the measurement viewing area.
When the marker bar is hidden, select
the
Show Marker Bar
button from the
Function
menu to show the marker bar.
Summary of Contents for 180 DSP
Page 20: ...www trilithic com 180 DSP Signal Level Meter Section I The Basics ...
Page 66: ...www trilithic com 180 DSP Signal Level Meter Section II Setup Menu ...
Page 175: ...www trilithic com 180 DSP Signal Level Meter Section III Autotest Menu ...
Page 197: ...www trilithic com 180 DSP Signal Level Meter Section IV Troubleshoot Menu ...
Page 361: ...www trilithic com 180 DSP Signal Level Meter Section V Utility Menu ...
Page 375: ...www trilithic com 180 DSP Signal Level Meter Section VI Appendix ...
Page 386: ...9710 Park Davis Drive Indianapolis IN 46235 317 895 3600 www trilithic com Made in U S A ...


