TI-83 Plus
Statistics
318
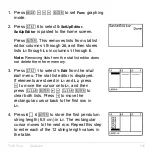
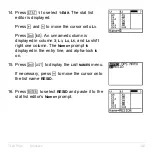
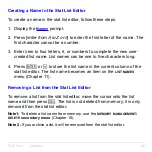
8. Press
Í
to select
On
, which turns on plot 1.
Press
†
Í
to select
"
(scatter plot). Press
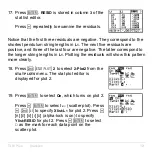
†
y
d
to specify
Xlist:L
1
for plot 1. Press
†
y
e
to specify
Ylist:L
2
for plot 1. Press
†
~
Í
to select
+
as the
Mark
for each data point
on the scatter plot.
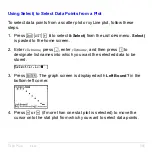
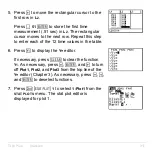
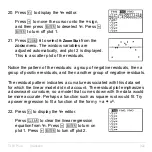
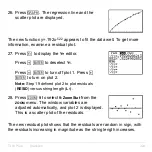
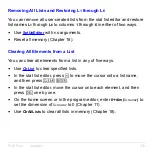
9. Press
q
9
to select
9:ZoomStat
from the
ZOOM
menu. The window variables are adjusted
automatically, and plot 1 is displayed. This is a
scatter plot of the time-versus-length data.
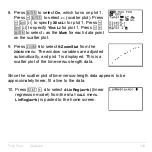
Since the scatter plot of time-versus-length data appears to be
approximately linear, fit a line to the data.
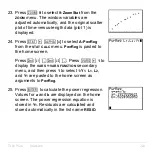
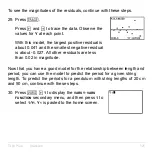
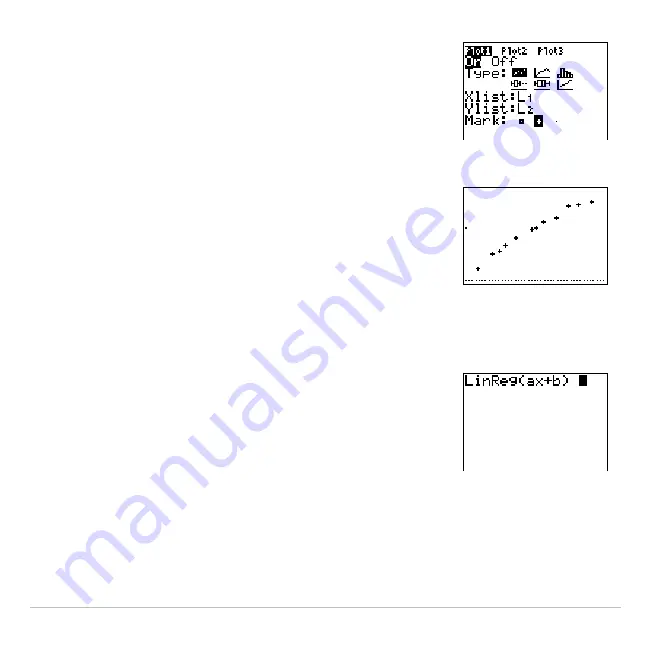
10. Press
…
~
4
to select
4:LinReg(ax+b)
(linear
regression model) from the
STAT CALC
menu.
LinReg(ax+b)
is pasted to the home screen.
Summary of Contents for 83PL/CLM/1L1/V - 83 Plus Calc
Page 407: ...TI 83 Plus Inferential Statistics and Distributions 404 Input Calculated results Drawn results...
Page 412: ...TI 83 Plus Inferential Statistics and Distributions 409 Data Stats Input Calculated results...
Page 454: ...TI 83 Plus Applications 451 tvm_FV tvm_FV computes the future value tvm_FV PV PMT P Y C Y...


