
TI-83 Plus
Activities
553
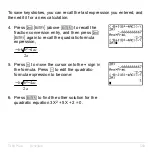
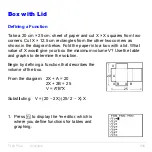
Box with Lid
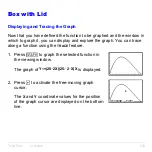
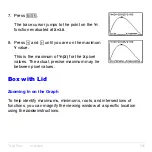
Displaying and Tracing the Graph
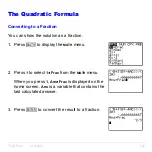
Now that you have defined the function to be graphed and the window in
which to graph it, you can display and explore the graph. You can trace
along a function using the
TRACE
feature.
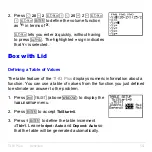
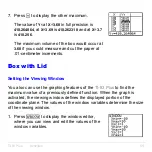
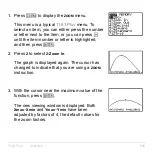
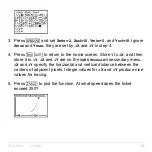
1. Press
s
to graph the selected function in
the viewing window.
The graph of
Y
1
=(20
N
2X)(25
à
2
N
X)X
is displayed.
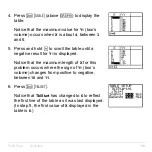
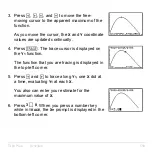
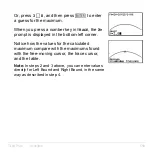
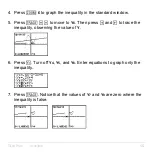
2. Press
~
to activate the free-moving graph
cursor.
The
X
and
Y
coordinate values for the position
of the graph cursor are displayed on the bottom
line.
Summary of Contents for 83PL/CLM/1L1/V - 83 Plus Calc
Page 407: ...TI 83 Plus Inferential Statistics and Distributions 404 Input Calculated results Drawn results...
Page 412: ...TI 83 Plus Inferential Statistics and Distributions 409 Data Stats Input Calculated results...
Page 454: ...TI 83 Plus Applications 451 tvm_FV tvm_FV computes the future value tvm_FV PV PMT P Y C Y...