TI-83 Plus
Function Graphing
133
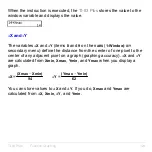
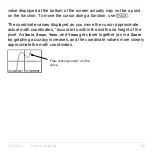
value displayed at the bottom of the screen actually may not be a point
on the function. To move the cursor along a function, use
r
.
The coordinate values displayed as you move the cursor approximate
actual math coordinates, *accurate to within the width and height of the
pixel. As
Xmin
,
Xmax
,
Ymin
, and
Ymax
get closer together (as in a
Zoom
In
) graphing accuracy increases, and the coordinate values more closely
approximate the math coordinates.
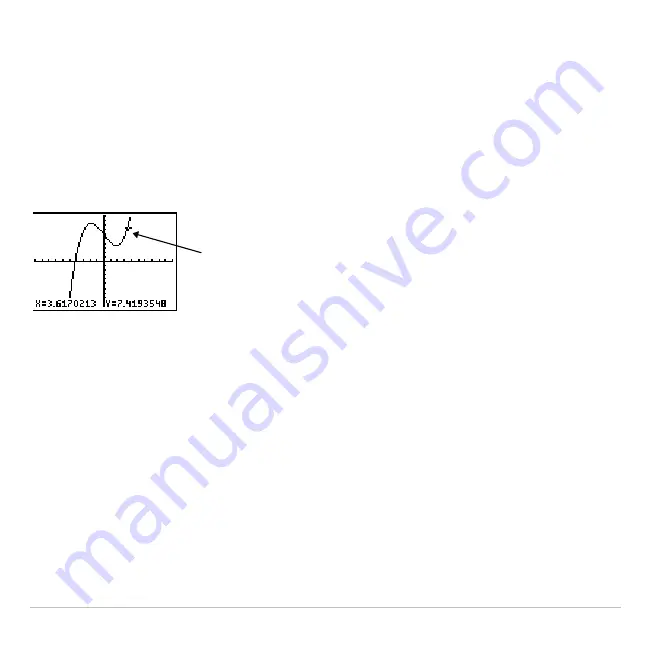
Free- moving cursor “on” the
curve
Summary of Contents for 83PL/CLM/1L1/V - 83 Plus Calc
Page 407: ...TI 83 Plus Inferential Statistics and Distributions 404 Input Calculated results Drawn results...
Page 412: ...TI 83 Plus Inferential Statistics and Distributions 409 Data Stats Input Calculated results...
Page 454: ...TI 83 Plus Applications 451 tvm_FV tvm_FV computes the future value tvm_FV PV PMT P Y C Y...

