TI-83 Plus
Parametric Graphing
157
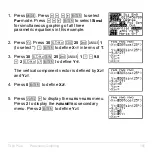
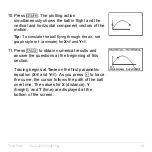
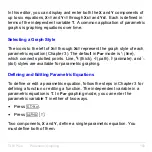
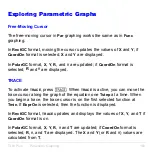
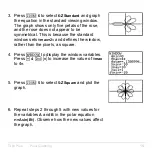
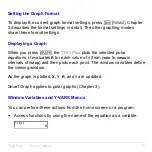
10. Press
s
. The plotting action
simultaneously shows the ball in flight and the
vertical and horizontal component vectors of the
motion.
Tip: To simulate the ball flying through the air, set
graph style to
ì
(animate) for X
1T
and Y
1T
.
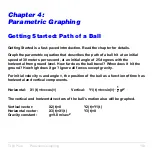
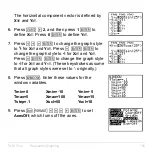
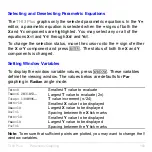
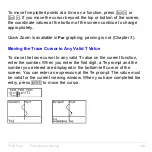
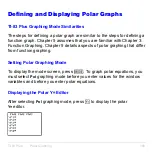
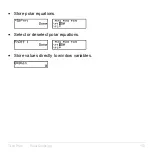
11. Press
r
to obtain numerical results and
answer the questions at the beginning of this
section.
Tracing begins at
Tmin
on the first parametric
equation (
X
1T
and
Y
1T
). As you press
~
to trace
the curve, the cursor follows the path of the ball
over time. The values for
X
(distance),
Y
(height), and
T
(time) are displayed at the
bottom of the screen.
Summary of Contents for 83PL/CLM/1L1/V - 83 Plus Calc
Page 407: ...TI 83 Plus Inferential Statistics and Distributions 404 Input Calculated results Drawn results...
Page 412: ...TI 83 Plus Inferential Statistics and Distributions 409 Data Stats Input Calculated results...
Page 454: ...TI 83 Plus Applications 451 tvm_FV tvm_FV computes the future value tvm_FV PV PMT P Y C Y...


