TI-83 Plus
Sequence Graphing
181
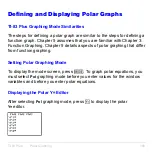
The sequence
Y=
editor displays the
n
Min
value because of its relevance
to
u(
n
Min)
,
v(
n
Min)
, and
w(
n
Min)
, which are the initial values for the
sequence equations
u(
n
)
,
v(
n
)
, and
w(
n
)
, respectively.
n
Min
in the
Y=
editor is the same as
n
Min
in the window editor. If you
enter a new value for
n
Min
in one editor, the new value for
n
Min
is
updated in both editors.
Note: Use
u(
nMin)
,
v(
nMin)
, or
w(
nMin)
only with a recursive sequence, which
requires an initial value.
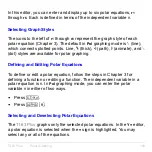
Selecting Graph Styles
The icons to the left of
u(
n
)
,
v(
n
)
, and
w(
n
)
represent the graph style of
each sequence (Chapter 3). The default in
Seq
mode is
í
(dot), which
shows discrete values. Dot,
ç
(line), and
è
(thick) styles are available for
sequence graphing. Graph styles are ignored in
Web
format.
Selecting and Deselecting Sequence Functions
The
TI-83 Plus
graphs only the selected sequence functions. In the
Y=
editor, a sequence function is selected when the
=
signs of both
u(
n
)=
and
u(
n
Min)=
are highlighted.
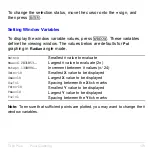
To change the selection status of a sequence function, move the cursor
onto the
=
sign of the function name, and then press
Í
. The status is
changed for both the sequence function
u(
n
)
and its initial value
u(
n
Min)
.
Summary of Contents for 83PL/CLM/1L1/V - 83 Plus Calc
Page 407: ...TI 83 Plus Inferential Statistics and Distributions 404 Input Calculated results Drawn results...
Page 412: ...TI 83 Plus Inferential Statistics and Distributions 409 Data Stats Input Calculated results...
Page 454: ...TI 83 Plus Applications 451 tvm_FV tvm_FV computes the future value tvm_FV PV PMT P Y C Y...

