TI-83 Plus
Parametric Graphing
161
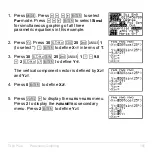
Setting the Graph Format
To display the current graph format settings, press
y
.
. Chapter
3 describes the format settings in detail. The other graphing modes
share these format settings;
Seq
graphing mode has an additional axes
format setting.
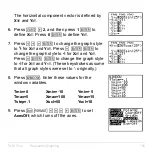
Displaying a Graph
When you press
s
, the
TI-83 Plus
plots the selected parametric
equations. It evaluates the
X
and
Y
components for each value of
T
(from
Tmin
to
Tmax
in intervals of
Tstep
), and then plots each point defined by
X
and
Y
. The window variables define the viewing window.
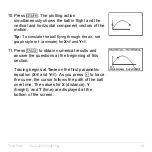
As the graph is plotted,
X
,
Y
, and
T
are updated.
Smart Graph applies to parametric graphs (Chapter 3).
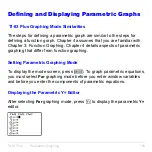
Window Variables and Y
.
VARS Menus
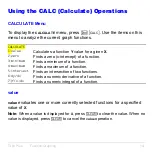
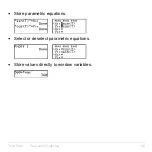
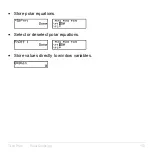
You can perform these actions from the home screen or a program.
•
Access functions by using the name of the
X
or
Y
component of the
equation as a variable.
Summary of Contents for 83PL/CLM/1L1/V - 83 Plus Calc
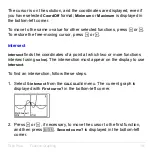
Page 407: ...TI 83 Plus Inferential Statistics and Distributions 404 Input Calculated results Drawn results...
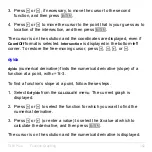
Page 412: ...TI 83 Plus Inferential Statistics and Distributions 409 Data Stats Input Calculated results...
Page 454: ...TI 83 Plus Applications 451 tvm_FV tvm_FV computes the future value tvm_FV PV PMT P Y C Y...