


Section 7.0 HMI Introduction
HGA IOM
88
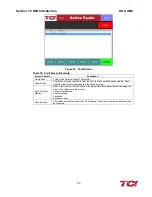
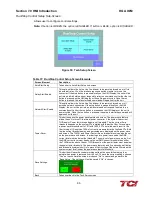
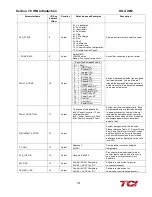
Figure 45: Historical Trend Plot Menu Sub Screen
Table 29: Historical Trend Plot Menu Sub Screen Elements
Screen Element
Description
Converter Temp Button
Opens the HarmonicGuard
®
Active filter heatsink temperature historical trend
graph screen. This signal is sampled every 15 seconds and historical data is
maintained for 10 hours.
Converter VLink Button
Opens the HarmonicGuard
®
Active filter DC Link Voltage historical trend graph
screen. This signal is sampled every 3 seconds and 2 hours of historical data is
maintained.
VLine Button
Opens the utility input RMS Voltage historical trend graph screen. This signal is
sampled every 3 seconds and 2 hours of historical data is maintained.
ILine/ILoad Button
Opens the line/load RMS current historical trend graph screen. This signal is
sampled every 3 seconds and historical data is maintained for 2 hours.
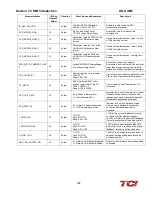
Converter Current
Button
Opens the HarmonicGuard
®
Active filter RMS current historical trend graph
screen. This signal is sampled every 3 seconds and 2 hours of historical data is
maintained.
Current THD Button
Opens the line/load Total Harmonic Distortion historical trend graph screen. This
signal is sampled every 3 seconds and 2 hours of historical data is maintained.
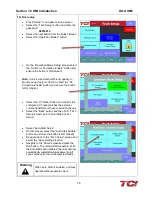
Historical Trend Plot Sub Screens
The historical trend plot screens graph time-stamped feedback data over an extended period.
Once the trend plot display data buffer is full, the oldest data is overwritten. Historical data can be
viewed using the integrated scroll bars of the trend plot. All trend plot data is maintained between
power on/off cycles of the HarmonicGuard
®
Active filter. See figure below for an example of a
typical trend graph (trend plot example is for the HarmonicGuard
®
Active filter power converter
heatsink temperature measurement).