Section 7.0 HMI Introduction
HGA IOM
85
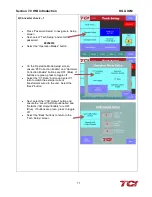
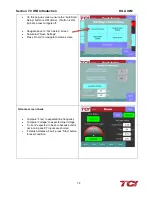
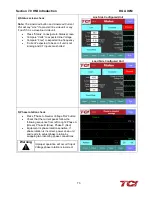
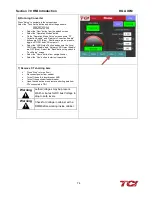
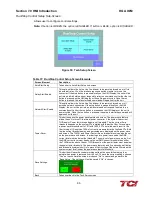
Figure 43: Example Waveform Plot Screens (Converter Corrective Current)
Table 27: Waveform Plot Sub Screen Elements
Screen Element
Description
Refresh Button
The “Refresh” button will reload the data from the HarmonicGuard
®
Active filter
power converter controller and redraw the waveform plot.
1X, 2X, and 4X Buttons
Waveform zoom buttons will redraw the present data at a different scale.
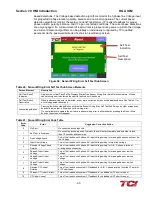
VLine & ILine Waveform Plot Sub-Screen
The VLine & ILine Waveform Plot Sub Screen is available to verify the proper installation of the
HarmonicGuard
®
Active filter power connections and system current CT feedbacks. The
waveform plot shows Voltage and current feedback for both Phase A and C on the same plot.
When the HarmonicGuard
®
Active filter is powered, but in the stopped state this plot can be used
to check for the following:
•
Proper Line Voltage phase rotation.
•
Proper Line/Load Current phase rotation.
•
Proper Line Voltage and Line/Load Current relative polarity and phase.
•
Missing/Open Circuit System Current CT Feedback.
If the HarmonicGuard
®
Active filter performance is degraded, the VLine & ILine waveform plot
should be examined to determine if any system connection errors are present. Prior to examining
the VLine & ILine waveform plot, the HarmonicGuard
®
Active filter should be put in the stopped
state by pressing the stop button in the upper right corner of the HMI screen. Figure 43 shows the
VLine & ILine waveform plot sub screen for a properly connected, but non-running
HarmonicGuard
®
Active filter when connected to a typical non-linear, rectifier load. Note the
following characteristics:
•
Phase C Voltage (Blue) leads Phase A Voltage (Green).
•
Phase C current (Yellow) leads Phase A current (Red).
•
Phase A Voltage (Green) and Phase A current (Red) are in phase and the same
polarity.

