•
For FDOM: Put a blue fluorescent stick in front of the FDOM (purple) light to
change the value of the data from the FDOM sensor. The value increases toward
the maximum output value listed on the sensor's characterization page.
3.
Make sure that the CTD and DO sensor have the output values as listed below.
•
Conductivity: 0.000 (+0.0005, -0.0001)
•
Temperature: current room temperature
•
Pressure: 0.00 (±0.5)
•
Raw Dissolved Oxygen: 3000–15000 Hz
•
Processed Dissolved Oxygen: 3–6.5 ml/L
2.2.1 Scroll data tab
The
Scroll Data
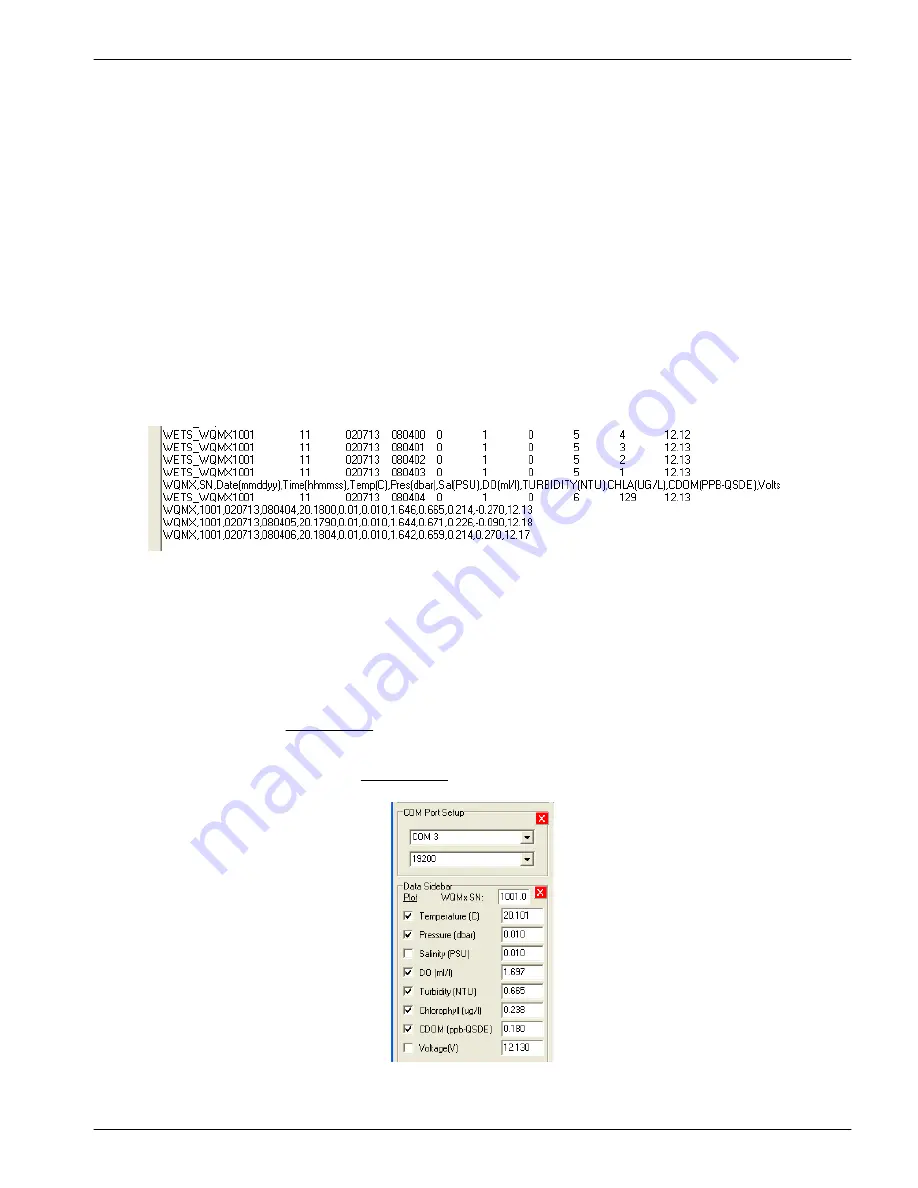
tab shows the data collection, the sensor's status records, and other
miscellaneous messages. Sensors that use version 1.5 or newer show data collection at
1 Hz. Older versions show the data collected once every 10 seconds when the sensor is
in air, and at 1 Hz when it is in water.
1.
Go to the
Scroll Data
tab.
2.
Monitor the collected data.
•
WETS_
...: These lines show the sensor's serial number and the conditions that
are used by the sensor in the setup and view controls.
•
WQM,SN,Date(mmddyy),
...:These lines show the column headings for the
collected data.
•
WQM,1001,0207013,
...: These lines show data records. These records are
transmitted at 1 Hz when the sensor collects data.
2.2.2 Data sidebar area
The Data Sidebar area shows the data and lets the user select the parameters that show
in the graph area of the
View Data
tab.
1.
Look at the Data Sidebar area on the left side of the software window to see which
parameters will show on the graph in the
View Data
tab.
Functional check
7


