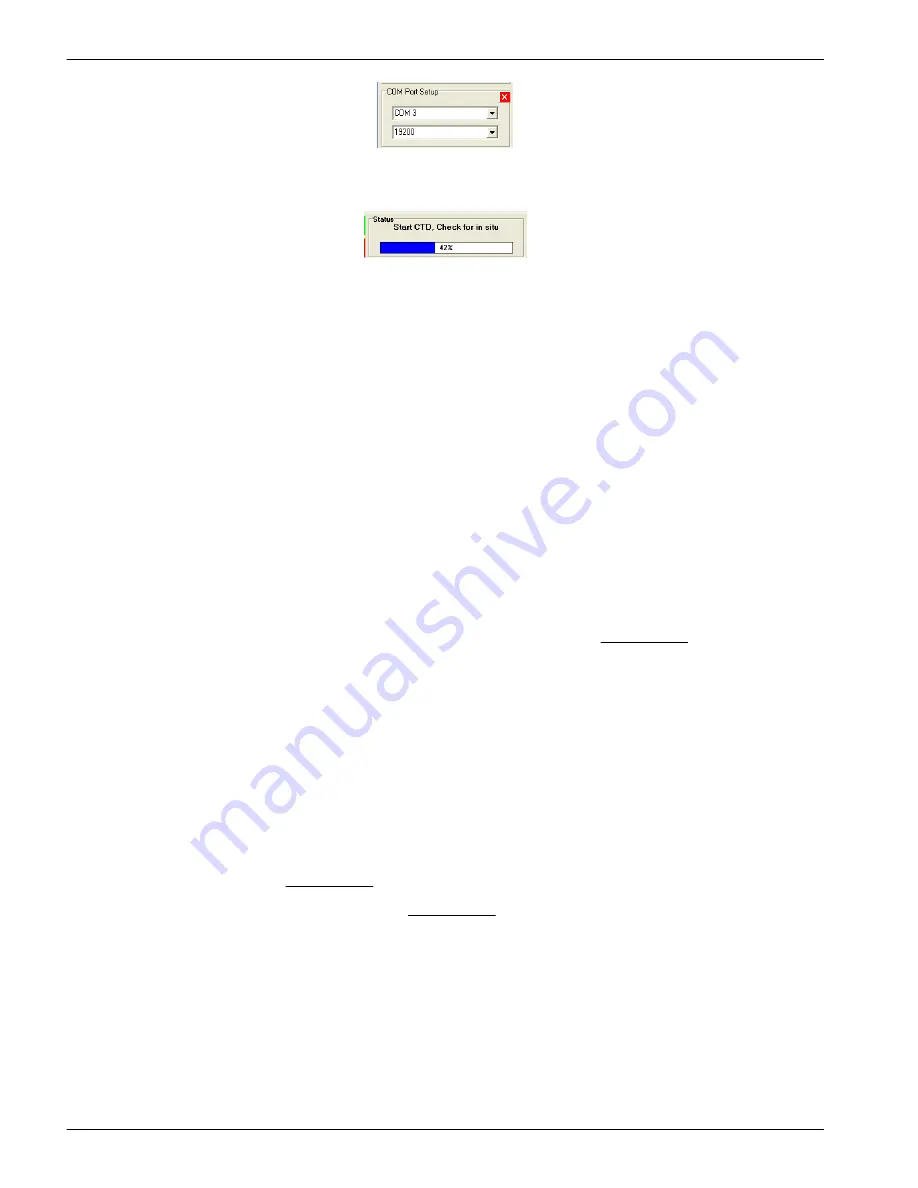
7.
Push
Start Sample
, then push
Start WQM Now
.
The sensor does a warm-up for the CTD, DO, and the optics before it starts the
Sample
mode. This sequence takes approximately 35 seconds.
8.
Push
Stop WQM Sample
, then push
Yes, Stop WQM Sampling
.
The sensor goes into
In Standby
mode. The user can now make changes to the
sensor setup.
9.
Go to the
WQM Setup
tab.
10.
Push
Set Date and Time
to make sure the PC and the sensor show the same date
and time.
11.
Go to The
WQM Output
tab.
12.
Make sure to select the boxes listed below:
a.
Conductivity
b.
Temperature
c.
Pressure
d.
Raw dissolved oxygen
e.
Processed dissolved oxygen
f.
Chlorophyll
g.
NTU
h.
FDOM (WQMx only)
Only those values with selected boxes are stored by the sensor as data. A data value
with a box that is not selected is not available in the Data Sidebar area or the
View
Data
tab.
13.
Push
Send Output Configuration
.
The selected parameters are stored in the sensor.
14.
Push
Start WQM Sample
.
The sensor starts its warm-up cycle.
2.2 Monitor data
There are three places in the software to monitor the data collected by the sensor.
•
The
Scroll Data
tab.
•
The
View Data
tab.
•
The Data Sidebar area.
1.
Look at the data in the Data Sidebar area.
2.
Change the values of the collected data:
•
For chlorophyll: Put an orange fluorescent stick in front of the chlorophyll (blue)
light to change the value of the data from the chlorophyll sensor. The value
increases toward the maximum output value listed on the sensor's
characterization page.
•
For NTU: Put a solid object such as a finger in front of the turbidity (red) light to
change the value of the data from the turbidity sensor. The value increases
toward the maximum output value listed on the sensor's characterization page.
Functional check
6


