The CFIP Lumina Series Full Outdoor Unit Technical Description and Configuration Guide
•
Rev. 1.3
•
© SAF Tehnika JSC 2010
73
1.
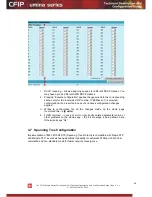
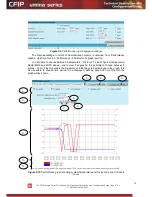
Time scale selector. User can select the scale and accuracy (1 / 15 / 60 minutes).
The lower the accuracy, the longer period will be available for data (mechanism of the
performance management system)
2.
Updates the performance graph; the latest data is shown
3.
Shows / hides period settings (point 5)
4.
Performance data selector. Only two performance parameters can be selected at a
time
5.
Period settings. Allows the user to specify time period for the graph
6.
Date and time fields. The date format is “yy-mm-dd”, the time format is “hh:mm”
7.
Sets date and time fields (point 6) one screen back / forth
8.
Shows / updates the performance graph using the period settings (point 5)
9.
Performance graph. Displays two performance parameters. Each parameter is shown
with the minimum and maximum curves, which are in the same color. The curves in
red have the scale on the left, while the curves in blue have the scale on the right
10.
Time scale. Shows the time scale chosen from the time scale selector (point 1) for
the performance data available. If no data is available for the according moment,
“__:__” is shown
11.
Legend for the curves of the performance graph. Contains the color, the name and
the unit of measurement, if available.
In case no performance data has been recorded,
or the period specified has no data, “No
data” is shown (instead of points 9, 10, 11).
5.2.4 Constellation Diagram
A constellation diagram is a representation of a signal modulated by the digital
modulation schemes 256QAM, 128QAM, 64QAM, 32APSK, 16APSK or QPSK. It displays the
signal as a two-dimensional scatter diagram in the complex plane at symbol sampling
instants. Measured constellation diagram can be used to recognize the type of interference
and distortion in a signal.
For the purpose of analyzing the received signal quality, some types of corruption are
evident in the constellation diagram. For example:
1) Gaussian noise is displayed as fuzzy constellation points:
Figure 5.11.
Gaussian noise (QPSK)

