5.4.3
The TEOAE test
The test as it progresses is shown on the display.
•
If needed, press the
Stop
button to stop the test. The test will be saved as an
incomplete test.
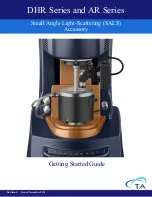
Test details
Shows which ear is being tested.
A.
Valid peaks
B.
Higher frequency emissions
C.
Lower frequency emissions
The graphic display shows the peaks
reaching the test criteria. The graph is a
statistical graph.
Valid peak
Shows that the intensity of a peak is valid and counted by the peak counter.
Peak counter
The test must register a total of at least 8 valid peaks in alternating directions
(counted both above and below the median line) in order to lead to a
Pass/Clear Response
.
Probe Fit
If the Probe Fit Assistant is enabled, this bar shows the quality of the probe fit.
The longer the bar, the better the probe fit. The indicator bar is green when the
probe fit is good; if the bar is gray, adjust the probe to improve the fit. (The
Probe Fit Assistant is disabled by default. It can be enabled or disabled in
AccuLink.)
46
Otometrics - MADSEN AccuScreen
5 Testing with AccuScreen