6-2
Section
SET (Setting) Mode
122
Procedure
1
Select
2.Image Analysis.
0.Image Adjust-QR
2
Select
Display Pixel Value.
Display Pixel Value
3
Move to the required area by using Up/Down/Left/Right
Keys.
The density information will be displayed.
Press the SHIFT Key at the same time to move faster.
4
Press the ESC Key to leave this screen.
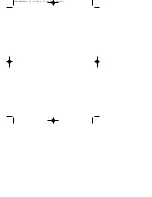
Line Bright (X), Line Bright (Y)
A graph indicating density distribution in a horizontal or vertical
line is called “Line Bright.”