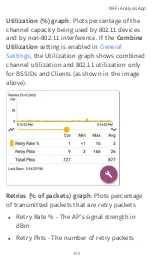
Utilization (%) graph
: Plots percentage of the
channel capacity being used by 802.11 devices
and by non-802.11 interference. If the
Combine
Utilization
setting is enabled in
, the Utilization graph shows combined
channel utilization and 802.11 utilization only
for BSSIDs and Clients (as shown in the image
above).
Retries (% of packets) graph
: Plots percentage
of transmitted packets that are retry packets
l
Retry Rate % - The AP's signal strength in
dBm
l
Retry Pkts - The number of retry packets
Wi-Fi Analysis App
498
Summary of Contents for ETHERSCOPE nXG
Page 20: ...Select Contents to view the list of chapters and choose a section to read Introduction 20...
Page 34: ...Home Screen Home and Android Interface 34...
Page 189: ...received either via Discovery Protocol advert isements or SNMP AutoTest App and Profiles 189...
Page 341: ...Ping TCP Test App 341...
Page 372: ...the screen to search discovered devices Discovery App 372...
Page 381: ...Back to Title and Contents See the Link Live chapter for more information Discovery App 381...
Page 413: ...Discovery App 413...
Page 420: ...Network Servers Network servers include NetBIOS DHCP and DNS servers Discovery App 420...
Page 423: ...Discovery App 423...
Page 432: ...Back to Title and Contents Discovery App 432...
Page 500: ...Touching Locate opens the RF and Traffic Statistics screen Wi Fi Analysis App 500...
Page 602: ...AirMapper App 602...
Page 684: ...Back to Title and Contents Link Live Cloud Service 684...


