Chapter 2
BridgeVIEW Environment
2-20
©
National Instruments Corporation
The Status Details dialog box, shown in Figure 2-6, displays a summary
of the status for each tag in the system. Tags that have a warning are
highlighted in blue, and tags in error are red. BridgeVIEW provides a
description of the error or warning when possible. Internal codes are
reported by BridgeVIEW; the Server Code is returned by the server
of the tag. Clicking on Status Details is equivalent to selecting
Tag Monitor»Status Details….
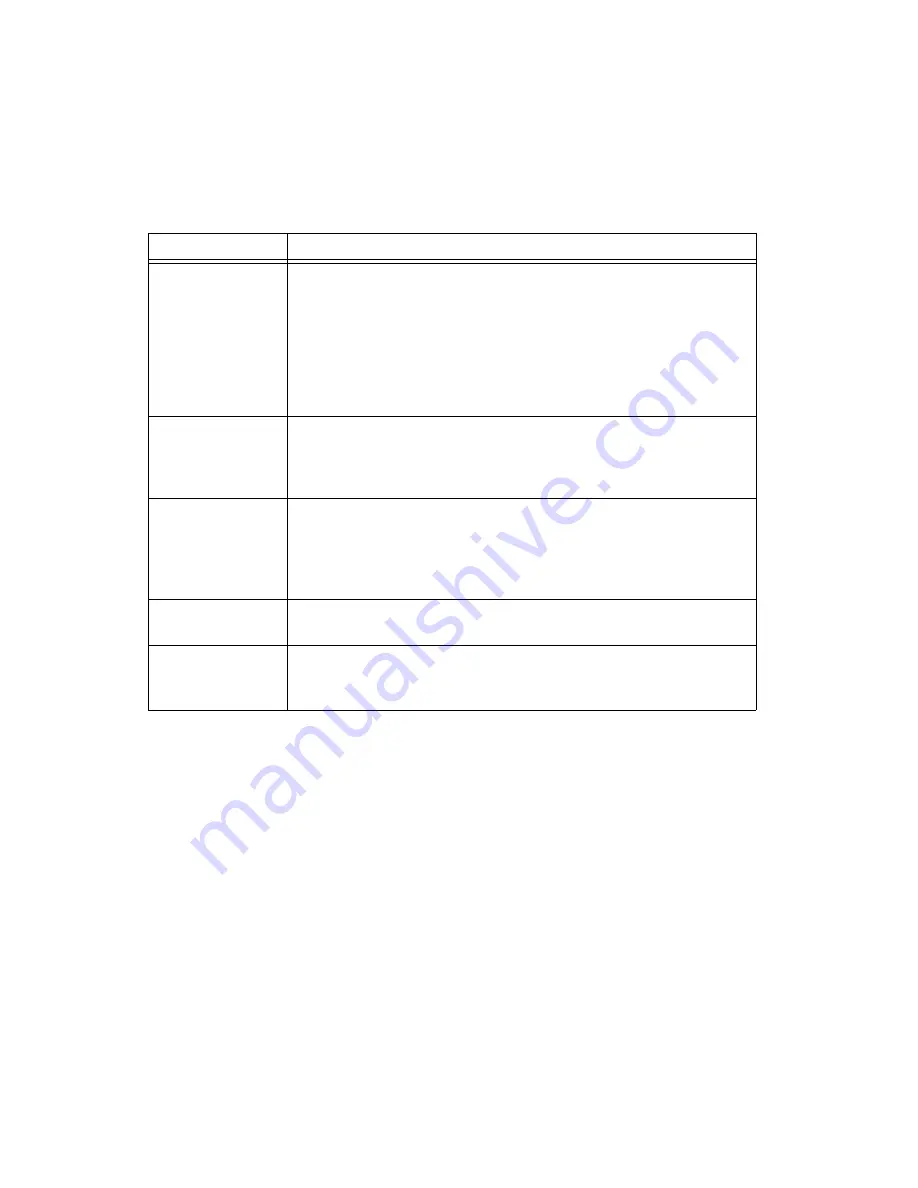
Table 2-4.
Tag Monitor Utility Field Descriptions
Field
Descriptions
Tag Display Table
Alphabetically lists the information for tags you have selected, including the
value, units, timestamp, status, alarm state and error, if any. For writable
tags, which have a yellow background, clicking on the tag's value field
brings up the Write to Tag dialog box, that lets you specify a new value for
that tag. For bit array tags, the radix of the input value must be the same as
that of the tag's value field in the Tag Display Table. Click OK to write the
value in Value to Input and exit the dialog box. Click Apply to write the
value in Value to Input and keep the dialog box open.
Trigger Tag
Displays which tag, if any, you have selected to trigger refreshing of the Tag
Display Table. If you selected a tag to trigger refreshing of the Tag Display
Table, the display refreshes when that tag changes value in the database, or
the monitor timeout period is exceeded, whichever occurs first.
Monitor Timeout
(sec)
Displays the time interval in seconds that the Tag Display Table is
configured to refresh or update. If no trigger tag is selected, the display
updates at this time interval. Otherwise, the Tag Display Table refreshes
when the tag changes or the timeout interval is exceeded, whichever
occurs first.
Status Details
Brings up the Status Details dialog box, shown in Figure 2-6, that displays
a summary of the status for each tag in the system.
Select Tags to
Monitor
Brings up the Select Tags to Monitor dialog box, shown in Figure 2-7, that
lets you select which tags to monitor and configure how often to refresh the
monitor display.


