Chapter 6
Historical Data Logging and Extraction
©
National Instruments Corporation
6-7
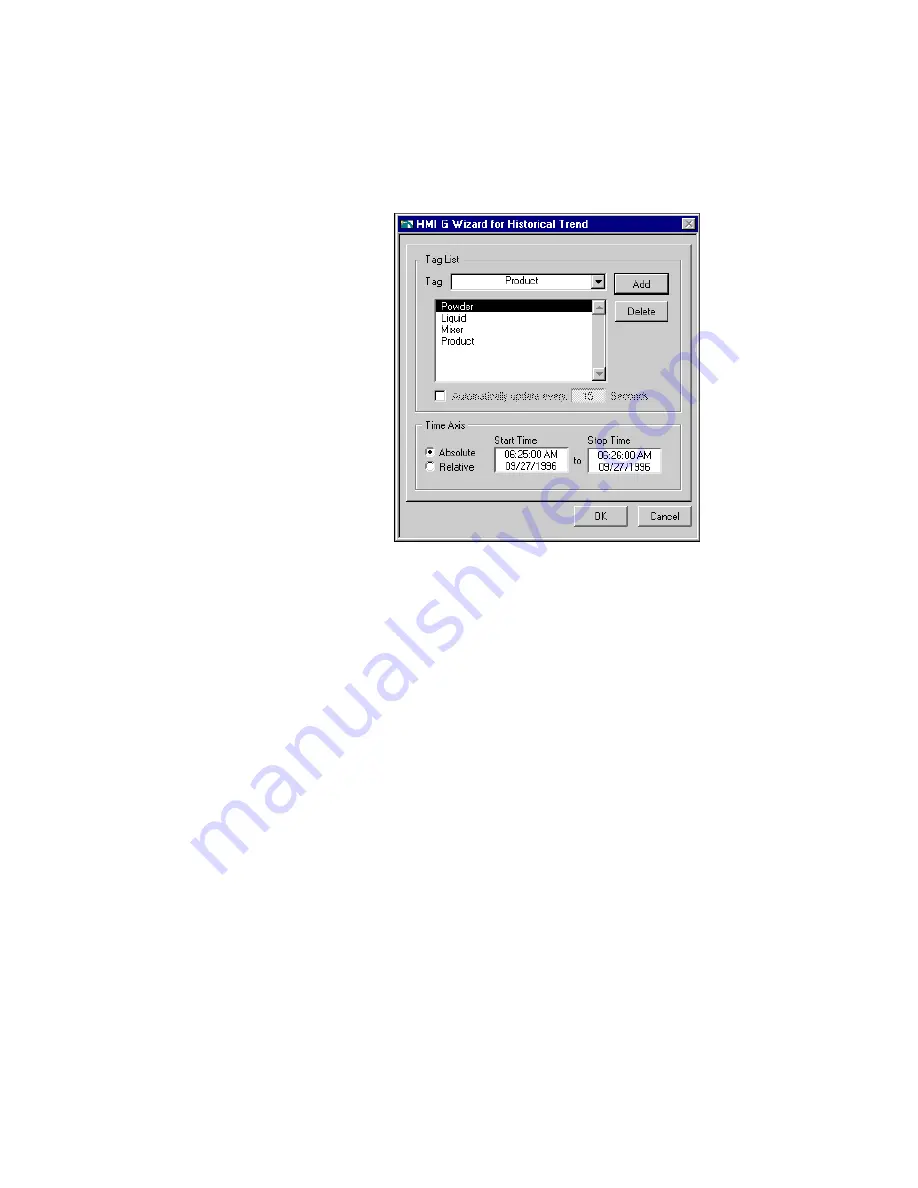
You will display previously logged data, which is included in the
BridgeVIEW\Activity\Data
directory. It contains a 25-minute run
of data. You can change the time axis to display the first minute of this
data.
3.
Run the VI. The trend displays one minute of data. You can use the
panning tool to grab the plot and scroll to the left or right to show more
data. Hold down the <Shift> key while you pan to constrain the
movement to the horizontal direction.
4.
Stop the VI.
5.
Modify the Block Diagram to incorporate statistics.
a.
In the block diagram, pop up on the wizard lock and select
Release Wizard Lock. Now, you can edit the diagram to
incorporate statistics into your data retrieval application.
b.
Using a For Loop and the
Historical Trend Statistics.vi
(Functions»Historical Data), build the diagram as shown below.
If you click and drag the Positioning tool inside the case structure
while holding down the <Ctrl> key, the diagram will expand to
give you some room to add the new diagram code.


