−
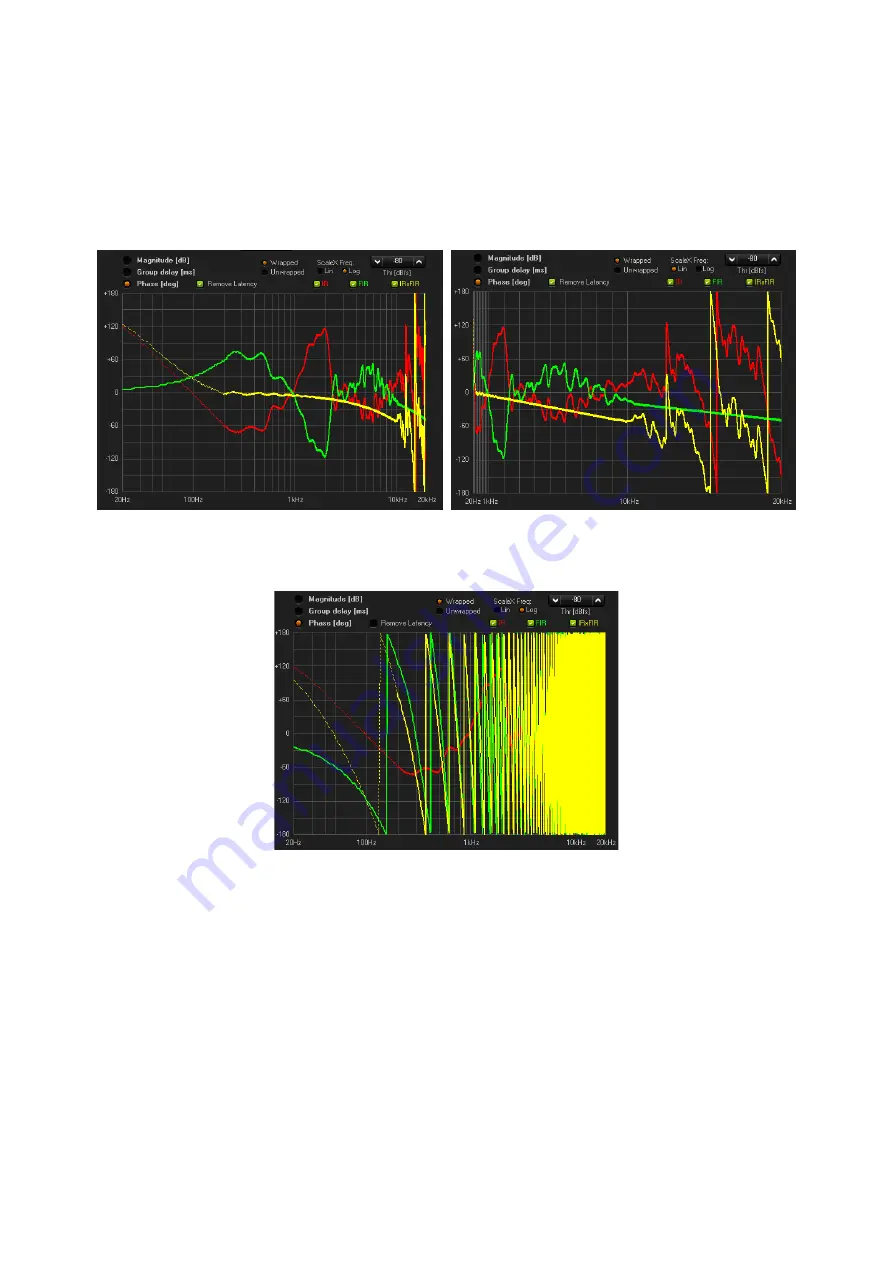
view the plot with/without the latency added by FIR.
−
Threshold, to remove the phase value on the frequencies where the module of the response is
under the threshold (this is because when the module of the response is very low, is not possible
to calculate with precision the value of the phase)
below the plot with wrapped phase, with Log and Lin scale frequencies and without latency:
below the plot with wrapped phase, with Log scale frequencies and with latency:
below the plot with unwrapped phase, with Log and Lin scale frequencies and without latency
(scaleY: from -300 Deg to 300 Deg, used the Zoom and Shift)
Summary of Contents for LPP-480F
Page 1: ...User Manual LPP 480F...
Page 49: ......


