


3.16 Web interface
3.16.1 Menu bar and Dashboard
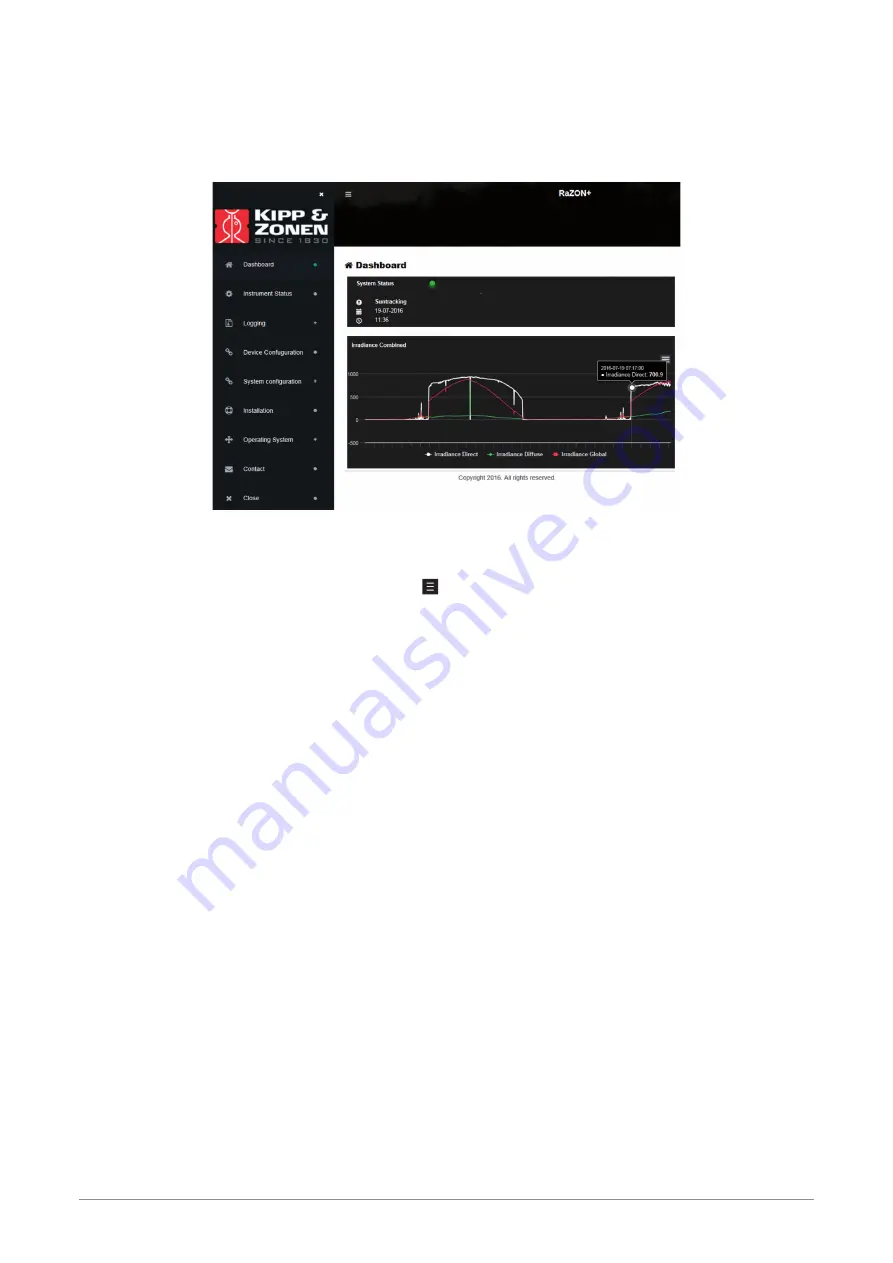
The above screen shows the menu bar and its first item, the dashboard.
The menu bar on the left can be opened (and closed) with the icon on top of the page and shows all options you can choose from.
The dashboard on the right gives on top an overview of its operating status. When the System Status LED is green, the RaZON
+
is
functioning correctly. If red or orange, the next item in the menu bar (Instrument status) give you detailed information about the
individual components. The showed time and date is Local Time (and not corrected for daylight saving).
The chart on the bottom right shows the combined irradiance over the last day. By clicking on the type of irradiance below the chart
you can switch its graph on or off. Zooming is possible by clicking and dragging over the desired part (or pinch on Smart device).
Clicking on an individual point in the chart shows its date, time and value.
Under Logging and Chart more graphic data options are available.
Summary of Contents for RaZON+
Page 1: ...RaZON Solar Monitoring System Instruction Manual ...
Page 2: ...2 ...
Page 4: ...4 ...
Page 6: ...6 ...
Page 12: ...12 ...
Page 42: ...42 ...
Page 44: ...44 ...
Page 50: ...50 ...
Page 52: ...52 ...
Page 71: ...71 Example of a logged ASCII data file via Wi Fi Logging Eport Log File ...


