26
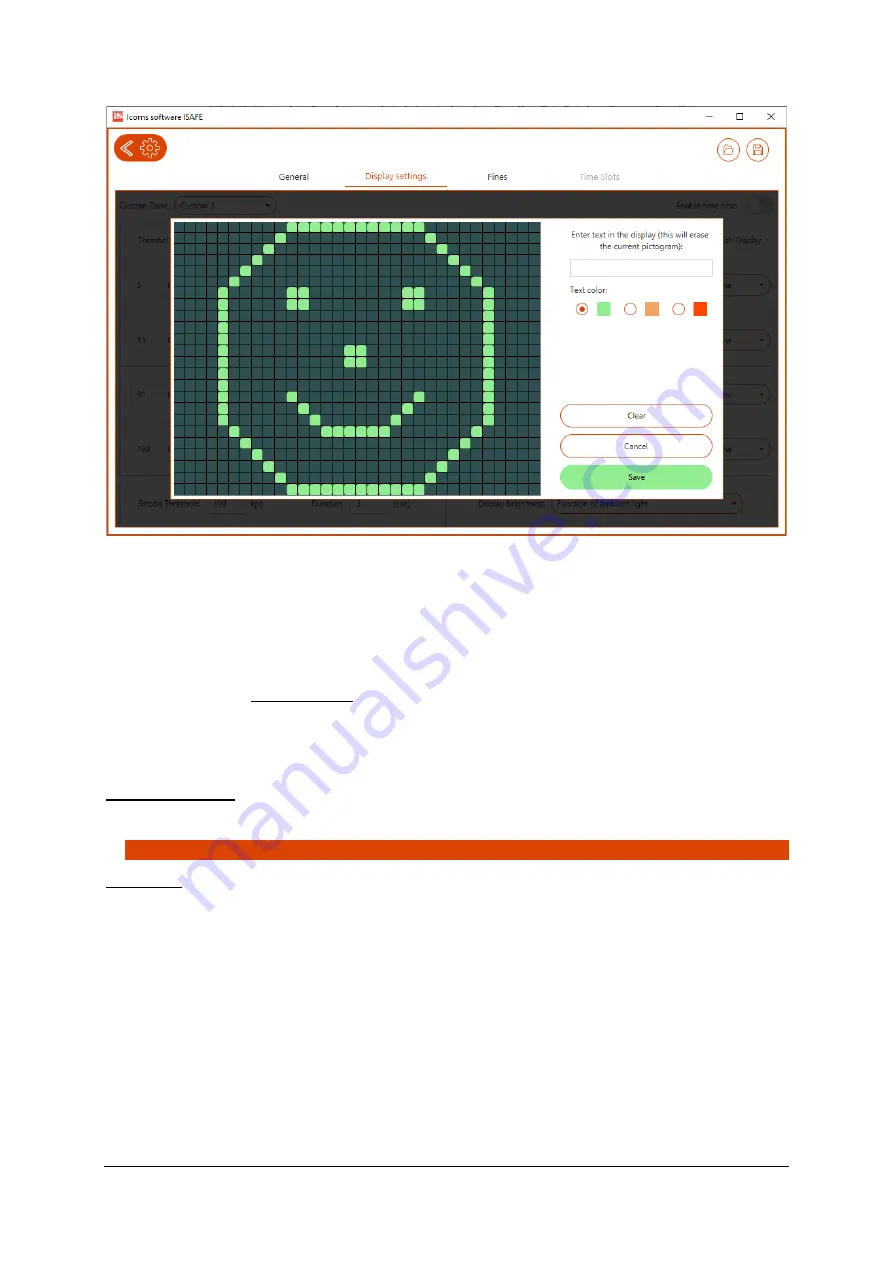
Screenshot 8: pictogram editor for the I-SAFE 1
Each square represents a LED pixel; every click on a square will change the colour according to the
sequence “nothing
-green-orange-
red”. Once the pictogram is modified or created, save it by clicking
on Save. You are then redirected to the pictogram library (Screenshot 7), where you can confirm your
choice, then on the LED setting screen (Screenshot 6).
To write text, use your keyboard to enter the text in the input box. The text will be shown in the editor
interface for preview.3: Flash display
For each threshold, you can activate or deactivate the blinking of the display. In the mode
“progressive”, bl
inking and intensity increase. The use of the blinking allows you to reduce the power
consumption of the display.
4: Strobe threshold
Choose here the speed from which you want to activate the flash.
To deactivate the flash, adjust its value to 199 km/h or mph.
5: Duration
The user can choose, according to circumstances and application, the time during which the speed is
displayed. Two display types are available:
•
fixed time display
: the display is maintained from 1 to 20 seconds (user's choice), no matter the
speed of the vehicles or the traffic density. The radar does not measure during the display. To
activate this display type, select a
value between 1 and 20.
•
In function of the speed of the vehicles
: the system calculates itself the duration of the display,
according to two parameters: the measured speed (the higher the speed, the shorter the display)
and the effective range of the radar (the distance at which it measures the vehicles: even if the
standard range is about 100 m, the actual range is 30 m if the system is installed at a distance of
30 m of a corner or any other hindrance). The best distance in most cases is 80 m. The following
calculation is made: t=range/speed. If a vehicle drives at 60 km/h (+/- 15 m/s), the display time for
a panel with an actual range of 80 m will be 5.3 sec. The longer the distance parameter, the longer


