ColorFlex EZ Citrus Citrus
User’s Manual Version 2.0
25
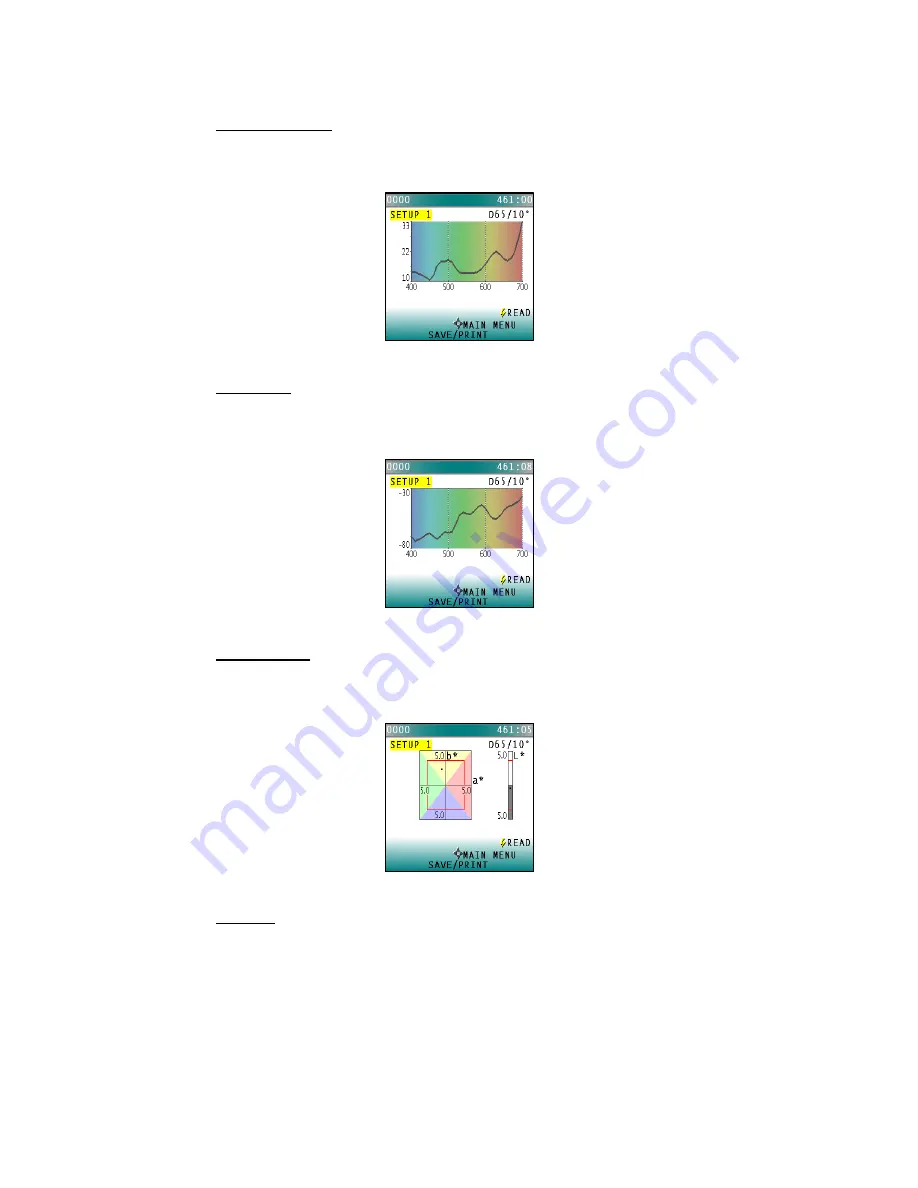
SPECTRAL PLOT
Spectral Plot graphs the raw reflectance values for each wavelength for the most
recent standard or sample.
Figure 37. Spectral Plot
DIFF PLOT
Spectral Difference plots the raw reflectance difference between the standard
and the most recent sample at each wavelength.
Figure 38. Plot of Spectral Difference
COLOR PLOT
Color Plot
displays the sample’s location in color space relative to the centered
standard.
Figure 39. Color Plot
ILL/OBS
Choose the illuminant/ observer combination under which color values will be
calculated. Use the down arrow button to move down to the Ill/Obs parameter,
then scroll through the choices using the right arrow button.
Summary of Contents for ColorFlex EZ Citrus
Page 6: ...ColorFlex EZ Citrus Citrus User s Manual Version 2 0 6...
Page 18: ...ColorFlex EZ Citrus Citrus User s Manual Version 2 0 18...
Page 44: ...ColorFlex EZ Citrus Citrus User s Manual Version 2 0 44...
Page 54: ...ColorFlex EZ Citrus Citrus User s Manual Version 2 0 54 Regulatory Notice...
Page 60: ...ColorFlex EZ Citrus Citrus User s Manual Version 2 0 60...


