background image


SOLAR300 - SOLAR300N 


EN - 53

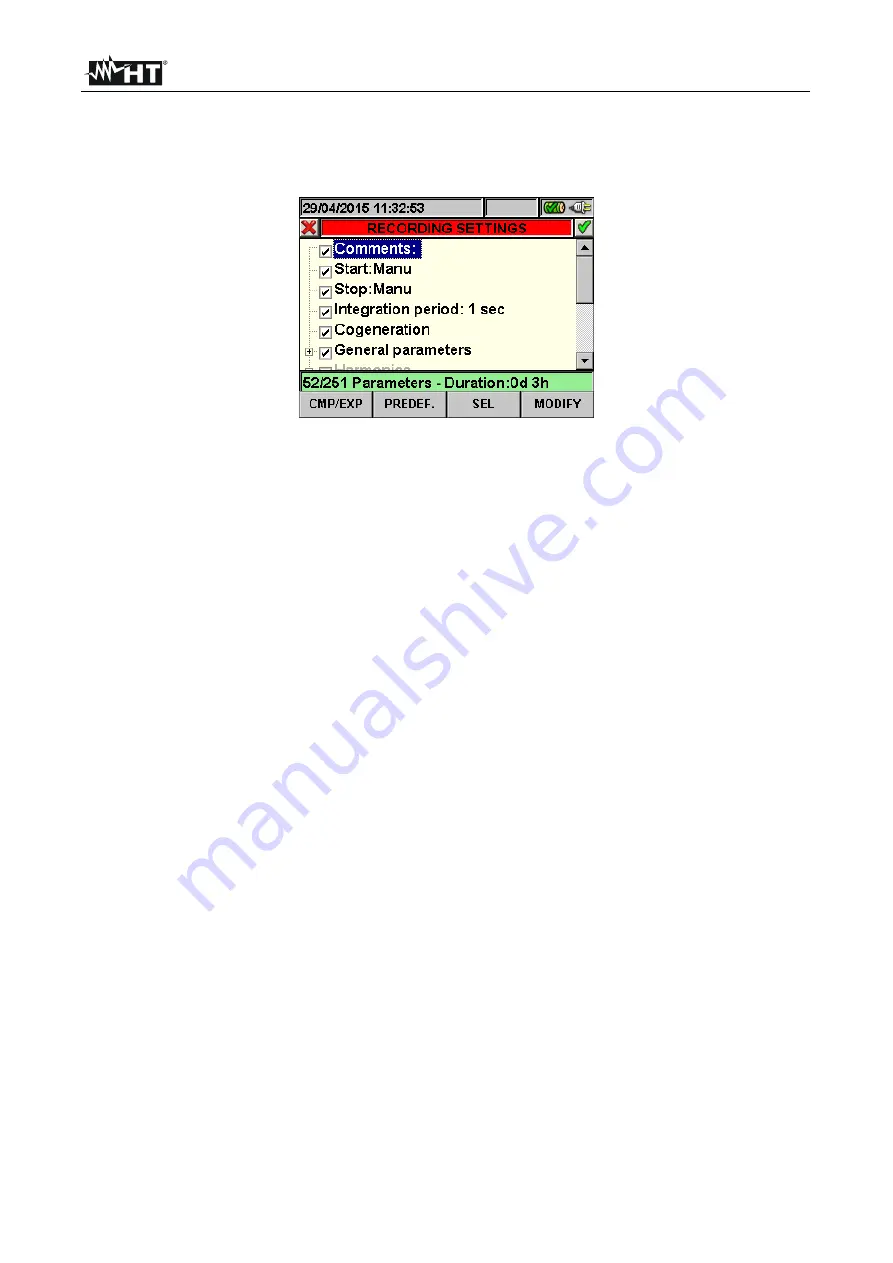
5.4.2.  Recording settings screen – NPV systems 

This screen is designed with some levels and sub-levels as a typical tree Windows 
structure in order to reach with extreme details the desired options. After selection of 
“Recording settings” icon, the below screen is shown: 


Fig. 79: Recording settings screen 

Using up and down arrows keys or touching directly the items at display the 
selection/disable of internal flags inside check box is possible. Click on check box with “

+

” 

symbol to cause an expansion of structure with the opening of a new sub-level inside 
which new selections are possible. Click on check box with “

-

” symbol to go back to master 

level. The displayed selection/disable of parameters is performed in the following way: 


Grey

 text and empty check box 

 Node completely disabled 


Black

 text and empty check box 

 Node partially selected 


Black

 text and selected check box 

 Node completely selected 

 
The bottom bar of display included the below functions, relative to 

F1

F2

F3

F4

 keys: 


CLP/EXP

: used to collapse or expand the sub-levels 


PREDEF.

: used to open the typical configuration section (see § 5.4.2.14) 


SEL

: used to select or disable parameters inside various levels 


MODIFY

: used to perform any parameters modify inside various levels 

 
On the bottom of display the number of selected parameters and the 

recording 

autonomy

, expressed in days and hours, is shown by meter. These s are dynamically 

updated from meter depending on the parameters selection. 
 

5.4.2.1. Comments  

These option permits to insert a short comment row at display which will compare also in 
print report downloaded from meter to PC. This comment text is set both using standard 
TopView software (for any information please refer to software Help on line) and by using 
the virtual keyboard on meter which is activated by pressing 

F4

 key (or the 

MODIFY

    at 

display). The flag of this option is always active and not disabled. 
 

Summary of Contents for SOLAR300

Page 1: ...Copyright HT ITALIA 2017 Release EN 2 10 02 05 2017 SOLAR300 SOLAR300N User manual...

Page 2: ......

Page 3: ...i MPPT photovoltaic system screen Single phase output 19 5 2 3 2 Multi MPPT photovoltaic system screen Three phase output 20 5 2 4 Value screens for NPV systems 20 5 2 4 1 Numerical screens sequence 2...

Page 4: ...edefined configurations 65 5 5 Start a test on PV system 73 5 5 1 While testing 75 5 5 2 Stop a test 76 5 6 Start a recording 77 5 6 1 Recording settings screen NPV systems only for NPV systems 80 5 6...

Page 5: ...ons relative to internal battery of instrument 134 8 4 Cleaning 135 8 5 End of life 135 9 TECHNICAL SPECIFICATIONS 136 9 1 Technical features 136 9 2 General features 139 9 3 Environment 139 9 4 Acces...

Page 6: ...e used in this manual and on meter Caution keep to what prescribed by the manual An incorrect use could damage the instrument or its components High voltage risk of electric shock Double insulation Th...

Page 7: ...overvoltage category 6 7 4 Measuring circuits OMISSIS Circuits are divided into the following measurement categories Measurement category IV is for measurements performed at the source of the low vol...

Page 8: ...he values of the electrical and environmental quantities irradiation temperature of a photovoltaic system for generating single phase or three phase electric power Calculation of the values regarding...

Page 9: ...lease contact your dealer Should it be necessary to return the instrument to the supplier please keep to the instructions given at 11 3 2 INSTRUMENT POWER SUPPLY The instrument can be powered only by...

Page 10: ...A1 A2 A3 for the connection of AC voltages 2 Inputs D1 D2 for the connection of DC voltages and N PE of AC voltages 3 Inputs for the connection of AC current transducers on phases L1 L2 L3 4 Input fo...

Page 11: ...play Keys ZOOM in ZOOM out these arrows keys permit to select the desired programmable parameters inside various screens The double function of ZOOM in and ZOOM out permits to change manually the full...

Page 12: ...is shown and the last row shows the short s associated to F1 F4 function keys An example of possible screen is shown on see Fig 5 Fig 5 Example of screen 4 4 RESET OF METER The meter is designed with...

Page 13: ...eneral settings section which permits to set the system parameters of meter as date hour language display brightness protection password keys sound on pressure auto power off and memory type see 5 1 R...

Page 14: ...Pressing ENTER key or touch the relative icon at display The below screen is shown by meter Fig 9 General Settings screen 5 1 1 Language selection 1 Move the cursor using arrows keys on field relative...

Page 15: ...12h 5 Press SAVE or ENTER keys or the smart icon to save the selected option and confirm by Ok This selected parameter will be present also the turning off of meter 6 Pressing ESC key or the smart ic...

Page 16: ...s shown in the below screen Fig 13 Insert Password screen 4 The fixed password not changeable by user to insert on meter within 10s from warning message is the below sequence of keys F1 F4 F3 F2 5 If...

Page 17: ...or disable the auto power off option in order to prevent a quick discharge of internal battery This feature if selected is active under each of the following conditions No action was performed both an...

Page 18: ...ENTER keys or the smart icon to save the selected option and confirm by Ok This selected parameter will be present also after turning off the meter 4 Press ESC key or the smart icon to exit by screen...

Page 19: ...V systems only further in this manual the acronym MPPT Multiple Power Point Tracker shall indicate the characteristic of the DC AC converter inverter capable of maximizing the DC power which can be ta...

Page 20: ...the photovoltaic panels Tenv Measured environmental temperature Fig 20 Three phase photovoltaic system page 5 2 3 Screen of photovoltaic systems with multi MPPT inverter only with MPP300 For the sake...

Page 21: ...ntal temperature When Tenv or Tpv values are displayed in blue it means that these values are different from the default ones as those measured by SOLAR 02 are not available see 5 3 2 4 Fig 21 Multi M...

Page 22: ...reen Three phase output Pressing the F3 DC key displays the following screen PARAMETER CAPTION Vdcx Inverter input DC voltage Idcx Inverter input DC current Pdcx Inverter input DC power x 1 2 3 accord...

Page 23: ...ed and Brown wires 020 Null voltage on the Black and Brown wires 003 Null voltage on the Black and Red wires Hz Frequency I1 Current on L1 phase I2 Current on L2 phase I3 Current on L3 phase IN Curren...

Page 24: ...damental of voltage L3 and current L3 Fig 31 Page of Phase 3 values PARAMETERS CAPTION Pst1 Short term severity after 1 minute Pst Short term severity Pstmax Maximum short term severity Plt Long term...

Page 25: ...r Value of the set integration period Rec Number of the recording in progress Fig 34 Producted energy page CAUTION The Total Produced Energy page is shown only if recording parameter Co generation has...

Page 26: ...d to any other selected system Simultaneous waveforms of voltages V1 V2 V3 and neutral voltage Vn for three phase 4 wire system and single phase with their TRMS values as shown in below screens Fig 36...

Page 27: ...ase for 4 wire systems In Manual mode inside Advanced Settings see 5 3 4 1 a customisation of full scale of voltage and current graphic is possible in order to improve the resolution on readings In th...

Page 28: ...or absolute value see 5 3 4 3 as below shown The positive value means the condition of absorbed harmonics mains loads direction while the negative value means the condition of generated harmonics loa...

Page 29: ...ues of single V1 V2 V3 voltages and neutral voltage Vn and single currents I1 I2 I3 and neutral current In for three phase 4 wire system with THD values both with histogram graphics and with numerical...

Page 30: ...I3 in order to understand in each moment the inductive or capacitive loads nature of electrical installations As an example below are shown the screens relative to a three phase 4 wire system Similar...

Page 31: ...or smart icon at display to exit from each screen and back to the previous one CAUTION The vectors of voltages are referred to the external circle on each diagram and the vectors of current are referr...

Page 32: ...ettings For single phase and three phase non photovoltaic electrical systems NPV Select the type of system the frequency the kind of current clamp the full scale of current clamp and the VT ratio of e...

Page 33: ...ms Three phase system 3 wire 3POD Open DELTA three wire system with 2 transformer windings ground USA systems Two phase system 3 wire 3P2E Three phase three wire system without Voltage current sensor...

Page 34: ...g 55 Analyzer configuration for MPP 3 system opt MPP300 required Fig 56 Analyzer configuration screen for 4 wire system Fig 57 Analyzer Configuration screen for 3 wire system Fig 58 Analyzer Configura...

Page 35: ...tion screen for SINGLE phase system Fig 60 Analyzer Configuration screen for Two phase system 3 wire 1Ph3W Fig 61 Analyzer Configuration screen for Two phase system 3 wire 3P 2E Fig 62 Analyzer Config...

Page 36: ...to quit without saving any modification 5 3 1 1 Setting system frequency 1 Move the cursor using arrows keys on field relative to Freq Hz marked with blue background 2 Use F3 or F4 keys alternatively...

Page 37: ...s are used the value of this parameter must be equal to the scale selected on the clamps If the type of system set is PV 1 or PV 3 MPP 1 MPP 3 it will be necessary to set the full scale both for the D...

Page 38: ...ngs ratio 1 Move the cursor using arrows keys on field relative to VT Ratio marked it with blue background 2 Use F3 or F4 keys alternatively touch MOD o MOD for selection of desired value from 1 to 30...

Page 39: ...ed in blue 2 By means of the F3 or F4 key or items MOD or MOD on the display select the desired value 3 Press the SAVE or ENTER key or the smart icon to save the selected setting by confirming with Ok...

Page 40: ...colour on the real time value section 1 Move the cursor on Tenv or Tpv by means of the up or down arrow keys so that it is highlighted in blue 2 By means of the F3 or F4 key or items MOD or MOD on th...

Page 41: ...st according to Italian guideline it is recommended to select T env Corr Type Temperature Tcel PRp calculation Ref T mod as Tmodule_Me Tcel C 40 Tcel if 100 40 Tcel 1 C 40 Tcel if 1 fv2 R n STC p ca P...

Page 42: ...onfirming with Ok In this way the settings made will remain valid also after turning off the instrument 3 To quit the settings made or to exit without saving press the ESC key or the smart icon 5 3 3...

Page 43: ...f DC clamp This option allow to set the corrective K factor relative only to the supplied HT4004 DC clamp which is indicated on the label in the backside of clamp see Fig 67 In case no label is presen...

Page 44: ...the resolution of readings 1 Move the cursor using arrows keys on field relative to Zoom graphics marked with blue background 2 Use F3 or F4 keys alternatively touch MOD o MOD to select one of below o...

Page 45: ...d harmonics type for the visualization the meter can performs the recording of all values in any case 5 3 4 3 Harmonics values option This option permits to select the value of harmonics which can be...

Page 46: ...ted parameter will be present also the turn off of meter 4 Press ESC key or the smart icon to quit without saving any modification 5 3 4 5 Average value option This option available for 4 wire systems...

Page 47: ...0 Example of Recording screen for Photovoltaic systems setting By using the up and down arrow keys or directly from the display it is possible to highlight the different internal items and to select d...

Page 48: ...f the software and interactively using the virtual keyboard which can be activated by pressing the F4 key or item MODIFY on the display The flag of this voice is always active and cannot be deselected...

Page 49: ...the desired integration period choosing between the following values 1s 5s 10s 30s 1min 2min 5min 10min 15min 30min 60min 4 Press the SAVE or ENTER key or the smart icon to save the setting made The s...

Page 50: ...ally provides the recording autonomy with the current settings CAUTION The activation of the flag of item General Parameters involves the automatic selection of the main parameters of the mains whose...

Page 51: ...S voltage L1 N downstream the inverter DC voltage DC voltage upstream the inverter AC current TRMS current of phase L1 downstream the inverter DC current DC current upstream the inverter Active power...

Page 52: ...ies for recording 5 4 1 8 Default settings The instrument allows to select the predefined DEFAULT configuration which is always used during any test on PV installation The instrument allows the user t...

Page 53: ...URATION PV systems GENERAL MENU SECTION PARAMETER SETTING Photovoltaic configuration Param Pnom W Not modified Te C Tc C Y C NOCT C Photovoltaic configuration Advanced Pyranometer mV kW m2 Irr Min W m...

Page 54: ...ARAMETER SETTING Recording configuration Comments empty Start Manu Stop Manu Integration period 5 sec 60min General Parameters MPP300 1 system VDCx IDCx PDCx Hz V1N I1 P1 Ea1 MPP300 3 system VDCx IDCx...

Page 55: ...selected Black text and selected check box Node completely selected The bottom bar of display included the below functions relative to F1 F2 F3 F4 keys CLP EXP used to collapse or expand the sub leve...

Page 56: ...ermits to define the method to enable and disable the recordings with meter see 5 6 The possible options are Manu each recording is enabled disabled in MANUAL mode by pressing GO STOP Auto each record...

Page 57: ...ODIFY at display In the bottom of display a command bar with Integration Period is shown 3 Press F3 key MOD or F4 MOD or up and down keys to set the desired integration period choosing among the below...

Page 58: ...alysis as Harmonics Voltage Anomalies Flicker etc are not possible Pressing F3 key or touch SEL at display to exit from this error condition In this order the flag of General Parameters check box it w...

Page 59: ...ne unit only In particular Frequency 1 selected parameter Voltage from 1 to 7 selected parameter depend on system Current from 1 to 4 selected parameter depend on system Powers and Energies from 1 to...

Page 60: ...rameters Description Frequency Frequency of phases L1 L2 L3 Voltages TRMS voltages L1 N L2 N L3 N N PE TRMS voltages L1 L2 L2 L3 L3 L1 Currents TRMS currents L1 L2 L3 Neutral Active Power Energy Activ...

Page 61: ...s possible Move the cursor on Odd or Even using arrows key and press F1 key or touch CLP EXP at display The result referred to Odd harmonics is below shown Fig 86 Harmonics sub levels odd harmonics se...

Page 62: ...t inside General Parameter sub level see 5 4 2 7 Fig 88 No selected voltages error screen To solve the error situation of above screen select the Voltages inside General Parameter sub level see 5 4 2...

Page 63: ...g arrows keys on field relative to Voltage Anom marked it with blue background 2 Use up or down arrow keys or press F3 or F4 keys alternatively touch the MOD or MOD s at display to setting the corresp...

Page 64: ...val expressed in seconds Possible values which can be set are 1s 2s 3s and 4s The detection type of inrush currents events The fix mode the event is detected whenever the input current value is over t...

Page 65: ...selection and a correct integration period are necessary conditions In particular if no voltage are selected the below screen is shown Fig 94 Flicker setting screen no selected voltage See the 5 4 2 6...

Page 66: ...setting screen Press F4 key alternatively touch MODIFY at display for setting the parameter for detection and recording of voltage spikes In particular is possible to set The value of voltage threshol...

Page 67: ...age anomalies dips peaks interruptions see 10 4 4 HARMONICS configuration of the parameters for voltage and current harmonic analysis see 10 5 5 INRUSH Setting parameters inrush current events detecti...

Page 68: ...iguration cab be removed in any time by pressing F2 key or the REM at display The warning message Delete selected configuration is shown by meter Press Ok to complete the operation Please note that th...

Page 69: ...period 10min Cogeneration OFF General Parameters V1N Hz Single phase V12 V23 V31 Hz ARON V1 PE V2 PE V3 PE V12 V23 V31 Hz 3 wire V1N V2N V3N Average if activated Hz 4 wire Voltage harmonics THD DC h1...

Page 70: ...em Start Not modified Stop Not modified Integration period 1min Cogeneration OFF General Parameters V1N VN PE Hz Single phase V12 V23 V31 Hz 3 wire ARON V1N V2N V3N VN PE Average if activated Hz 4 wir...

Page 71: ...n period 10min Cogeneration OFF General Parameters V1N VN PE I1 Hz Single phase V1 PE V2 PE V3 PE V12 V23 V31 I1 I2 I3 Hz 3 wire V12 V23 V31 I1 I2 I3 Hz ARON V1N V2N V3N VN PE I1 I2 I3 IN only PQA82x...

Page 72: ...Pf1 Cosphi1 Ea1 Eri1 Erc1 Single phase Pt P1 P2 P3 Qti Qti1 Qti2 Qti3 Qtc Qtc1 Qtc2 Qtc3 St S1 S2 S3 Pft Pf1 Pf2 Pf3 Cosphit Cosphi1 Cosphi2 Cosphi3 Eat Eat1 Eat2 Eat3 Erit Eri1 Eri2 Eri3 Erct Erc1 E...

Page 73: ...1 I1 I2 I3 IN only PQA82x Hz 4 wire P1 Q1i Q1c S1 Pf1 Cosphi1 Ea1 Eri1 Erc1 Single phase Pt P1 P2 P3 Qti Qti1 Qti2 Qti3 Qtc Qtc1 Qtc2 Qtc3 St S1 S2 S3 Pft Pf1 Pf2 Pf3 Cosphit Cosphi1 Cosphi2 Cosphi3 E...

Page 74: ...Qti Qi1 Qi2 Qi3 Qtc Qc1 Qc2 Qc3 St S1 S2 S3 Pft Pft1 Pft2 Pft3 Cosphit Cosphi1 Cosphi2 Cosphi3 Eat Ea1 Ea2 Ea3 Erit Eri1 Eri2 Eri3 Erct Erc1 Erc2 Erc3 Voltage harmonics THD DC h1 h2 h3 h11 Current har...

Page 75: ...maximizing the DC power which can be taken from the photovoltaic field see the 10 3 for further details the acronym PRp shall indicated the Performance ratio evaluated on active powers Fig 100 Exampl...

Page 76: ...SOLAR 0x unit with no active recording has been connected to a instrument unit during the testing recording phase Testing in progress This message is displayed when a testing is being carried out and...

Page 77: ...ent field of section Analyzer setting see 5 4 2 1 Type data and hour when recording started Type of recording stop always manual The Integration Period set The number of integration periods made in re...

Page 78: ...ith minimal test requirements if the Irradiance values were not steady or never reach minimum Irradiance value Press SAVE to save the results obtained Pressing the key will display the virtual keyboar...

Page 79: ...picture as shown in Fig 104 This operation can be performed in the below ways MANUAL Recording will start at the following minute after pressing GO STOP key AUTO Only if the instrument is configured...

Page 80: ...any selected parameters Fig 107 Warning message of too many selected parameters In this case of too many parameters were selected it is necessary to disable them inside Recordings Settings section in...

Page 81: ...is displayed when trying to start stop a recording where item SOLAR 0x is flagged while no connection to unit SOLAR 0x has been detected Do you want to stop recording Message which asks the user for c...

Page 82: ...e corresponding series of values won t be transferred to the definitive memory 5 6 1 Recording settings screen NPV systems only for NPV systems To start a recording under automatic mode a preliminary...

Page 83: ...m set Fig 112 Info recording running screen 3 The below information are included in the above screen Recording autonomy in Days Hours of meter with the currents selections performed Comments included...

Page 84: ...rded The type of clamp used The full scale selected for the clamps used 5 Pressing ESC key or the smart icon to quit from the above screen Each recording running is stopped and results are automatical...

Page 85: ...numerical waveforms harmonics PV tests etc performed by pressing the SAVE key RegPV type recordings performed on photovoltaic systems and saved by pressing the GO STOP key or tests of photovoltaic sys...

Page 86: ...k to the previous screen 5 7 1 Recording analysis Reg type This page shows the analyses which can be performed on the saved data Reg type Fig 116 Recording analysis Reg type data 1 Use the up and down...

Page 87: ...page The up and down arrow keys move the cursor along the quantity tree The F1 key or the CMP EXP item on the dislay compresses and expands the tree of the quantity highlighted by the cursor The F2 ke...

Page 88: ...eys or the MOD and MOD items on the display enable the user to choose YES or NO for the advanced graph The ENTER key or the smart icon on the display confirms the selection previously made The ESC key...

Page 89: ...reduction or overvoltage The following keys are active on this page The up and down arrow keys move the cursor along the voltage anomalies The up and down arrow keys move the column display to the rig...

Page 90: ...n Type or Phase The F3 and F4 keys or the MOD and MOD items on the display enable the user to filter the anomalies to be selected It is possible to select All Up Down Int if the cursor highlights Type...

Page 91: ...or with the MOD or MOD items on the display The F2 key or the PARAM item on the display accesses the page which shows the settings made for the Spikes see Fig 125 The ESC key or the smart icon exits t...

Page 92: ...t arrow keys move the column display to the right or to the left The F1 key or the PAG item on the display moves to the following pages of Inrush Currents to be selected with the F3 or F4 key or with...

Page 93: ...llow filtering the Inrush Currents to be selected It is possible to select All Phase1 Phase2 Phase3 Neutral The ENTER key or the smart icon on the display confirms the choice previously made and displ...

Page 94: ...um measured value Max Maximum measured value Limits Set reference limits Within this page the following keys are active The up and down arrow keys move the cursor along the different quantities The ri...

Page 95: ...rd EN50160 The ESC key or the smart icon exits the function and goes back to the EN50160 analysis result page see Fig 129 This page shows The global result of the analysis highlighted in red in case i...

Page 96: ...ak Max active power peak measured on 16 periods of mains frequency consumed while recording Date Ppeak Date and time in which the power peak occurred Start rec Starting date of the recording Stop rec...

Page 97: ...16 periods of mains frequency produced while recording Date Ppeak Date and time in which the power peak occurred Start rec Starting date of the recording Stop rec Stopping date of the recording Rec T...

Page 98: ...e ESC key or smart icon to exit the function and go back to the Recording analysis page Fig 115 5 7 2 1 Recording information This page contains general information about the recording RecPV file prev...

Page 99: ...ee 5 3 3 3 the difference between Maximum and Minimum values of irradiance in the same point is 20W m2 with IP 1min If more points satified the a m conditions the meter consider the point corresponden...

Page 100: ...1 2 3 AC voltage at inverter output Iac1 2 3 AC current at inverter output Irr Solar irradiation Pnom Nominal power of the photovoltaic system Tpv Temperature of photovoltaic panels Tenv Environmental...

Page 101: ...rradiation for a detected measuring point when with AVERAGE irradiation value measured by the pyranometer minimum threshold set see 5 3 3 3 the difference between the maximum and minimum irradiation v...

Page 102: ...on the display compresses and expands the tree of the quantity highlighted by the cursor The F2 key or the SEL item on the display selects or deselects the parameter highlighted by the cursor The ENT...

Page 103: ...display to access the page for the activation of the Advanced Graph Fig 121 Fig 142 Options Advanced Graph The following keys are active on this page The F3 and F4 keys or the MOD and MOD items on th...

Page 104: ...e performed 2 Press the ESC key or the smart icon on the display to exit the function and go back to the Saved data page Fig 115 5 7 3 1 Recording information This page contains general information ab...

Page 105: ...nd go back to the Recording analysis page Fig 143 5 7 3 3 Harmonics analysis This screen Fig 146 displays the harmonic values and the THD value of voltages V1 V2 V3 Vn and of currents I1 I2 I3 and of...

Page 106: ...to exit the function and go back to the Recording analysis page Fig 143 5 7 3 4 Vectors As an example below are shown the screens relative to a three phase 4 wire system Similar consideration can be...

Page 107: ...e L3 Phase L1 Voltage Inv value of the Negative sequence unbalance Omo value of the Zero sequence unbalance SEQ Phase sequence 123 Correct 132 Not correct 023 No Voltage on B1 103 No Voltage on B2 120...

Page 108: ...ard screen where the user can define the file name to save inside Pen Driver USB is shown by meter Fig 150 Definition of file name which is saved on Pen Driver USB Press SAVE or ENTER keys or the smar...

Page 109: ...pact flash not fitted was been considered Insert compact flash on meter exit from the above screen by pressing ESC key or the smart icon and open again the same screen the below screen is shown by met...

Page 110: ...meaning of the items inside the above screen Item Description Manufacturer Name of manufacturer Model Name of model Sn Serial number of meter Hw Internal Hardware version of meter Fw Internal Firmwar...

Page 111: ...Press the Select new instrument key in software screen in order to acknowledge the name of connected meter which is shown in the bottom status bar Select SOLAR300N model from the available list of me...

Page 112: ...ing will be used although often the term photovoltaic field would be more correct From the point of view of the instrument the management of a single string or of more parallel strings photovoltaic fi...

Page 113: ...to the set values 2 Connect inputs D1 and D2 to the positive and negative string output pole respectively Connect inputs A1 and A2 to the phase and neutral conductors respecting the colors as shown in...

Page 114: ...uth the back of the panel fixed by tape and do not touch it to avoid a wrong measurement 12 Connect the irradiation and temperature probes respectively to the inputs PYRA and TEMP of the SOLAR 01 unit...

Page 115: ...of SOLAR 02 2 Use the remote unit SOLAR 02 in independent mode to perform a possible preliminary measurement of irradiance 3 Connect inputs D1 and D2 to the positive and negative string output pole r...

Page 116: ...for a correct fixing 13 Position the temperature sensor typically in contact wuth the back of the panel fixed by tape and do not touch it to avoid a wrong measurement 14 Connect the irradiation and te...

Page 117: ...and negative string output pole respectively Connect inputs A1 A2 and A3 to the phase conductors respecting the colors as shown in Fig 161 CAUTION BEFORE CONNECT DC CLAMP ON CONDUCTOR Turn on the cla...

Page 118: ...lls 11 Position the pyranometer on the plane of the photovoltaic panels and the temperature sensor typically in contact wuth the back of the panel fixed by tape and do not touch it to avoid a wrong me...

Page 119: ...mode to perform a possible preliminary measurement of irradiance CAUTION BEFORE CONNECT DC CLAMP ON CONDUCTOR Turn on the clamp select the correct range and press the ZERO key to the DC clamp in order...

Page 120: ...ference cell please refer to 4 2 of it s user manual for a correct fixing 13 Position the temperature sensor typically in contact wuth the back of the panel fixed by tape and do not touch it to avoid...

Page 121: ...inverter see 10 3 and single phase or three phase output The remote unit MPP300 is capable of communicating with SOLAR300N via USB cable to manage data synchronization and download and with the remot...

Page 122: ...ings relevant to the type of remote unit to the minimum irradiation threshold to the full scale of the AC and DC clamps and to the parameters of the system being measured see 5 3 3 1 5 3 3 3 5 3 1 2 5...

Page 123: ...ems in which no Neutral conductor is available connect input N to earth 13 In case of inverter with three phase output see settings in 5 3 1 repeat the operation described in the step above for the re...

Page 124: ...ltage between Phase and Neutral if single phase or between Phases x and y if three phase Iacx ac current of phase x Pacx ac power of phase x We recommend checking that the values of the electrical par...

Page 125: ...for a correct assembly 25 Put the temperature sensor in contact with the rear side of the module and fasten it with some tape prevent touching it with your fingers as this could alter the measure 26 W...

Page 126: ...ist on the PV installation a stable irradiance condition more than the minimum irradiance threshold see 5 3 3 3 Display the best performance values if during the recording the Irradiance values reache...

Page 127: ...nect the transducer current clamp on L1 Phase cable as shown in Fig 165 respecting the clamp s arrow direction indicating the current standard sequence from generator to load On Real Time Values secti...

Page 128: ...cation see 5 2 4 1 and perform the corrections if necessary 3 Connect the transducer current clamps on Phase L1 L2 L3 and Neutral N cables as shown in Fig 166 respecting the clamp s arrow direction in...

Page 129: ...ndication see 5 2 4 1 and perform the corrections if necessary 3 Connect the transducer current clamps on Phase L1 L2 L3 cables as shown in Fig 167 respecting the clamp s arrow direction indicating th...

Page 130: ...2 4 1 and perform the corrections if necessary 3 Connect the transducer current clamps on Phase L1 L2 L3 cables as shown in Fig 168 respecting the clamp s arrow direction indicating the current standa...

Page 131: ...d perform the corrections if necessary 3 Connect the transducer current clamps on Phase L1 L2 L3 and N cables as shown in Fig 169 respecting the clamp s arrow direction indicating the current standard...

Page 132: ...4 1 and perform the corrections if necessary 3 Connect the transducer current clamps on Phase L1 L2 L3 cables as shown in Fig 170 respecting the clamp s arrow direction indicating the current standar...

Page 133: ...rrent clamps on Phase L1 L2 N cables as shown in Fig 171 respecting the clamp s arrow direction indicating the current standard sequence from generator to load On Real Time Values section screens sele...

Page 134: ...rrent clamps on Phase L1 L2 N cables as shown in Fig 172 respecting the clamp s arrow direction indicating the current standard sequence from generator to load On Real Time Values section screens sele...

Page 135: ...urrent clamps on Phase L1 L2 N cables as shown in Fig 173 respecting the clamp s arrow direction indicating the current standard sequence from generator to load On Real Time Values section screens sel...

Page 136: ...REC indicates that the battery is low In this case stop the measurements in progress turn off the instrument by means of the appropriate ON OFF key and disconnect the external probes Remove the cover...

Page 137: ...to clean the meter Do not use never wet clothes solvents water etc and take particular care at TFT display 8 5 END OF LIFE CAUTION this symbol indicates that equipment batteries and its accessories sh...

Page 138: ...on Time 50Hz resolution 0 0 600 0V 1 0 rdg 2dgt 10ms 0 2V 10ms Maximum peak factor 2 The voltage values 2 0 V are zeroed The instrument can be connected to TV with Factor selectable between 1 3000 Sel...

Page 139: ...rest factor 3 Current values 5A are considered zero by meter Inrush Current Range Accuracy Resolution Time resolution 50Hz Time accuracy 50Hz Depending on clamp type 1 0 rdg 0 4 FS Depending on clamp...

Page 140: ...le phase Three phase systems Range Accuracy Resolution 0 20 1 00 1 0 0 6 0 01 Voltage Current harmonics Range Accuracy Resolution DC 25a 5 0 rdg 5digits 0 1V 0 1A 26a 33a 34a 49a Accuracy to add at co...

Page 141: ...uded battery 1 0kg 35 ounces Reference standards Safety of meter IEC EN61010 1 Technical literature IEC EN61187 Safety standard accessories IEC EN61010 031 IEC EN61010 2 032 Insulation Double insulati...

Page 142: ...mp measured n ca cel p STC P P T G G PRp 25 100 1 where Symbol Description Meas unit p G Irradiance on PV module surface 2 W m STC G Standard Irradiance 1000 2 W m n P Nominal Power sum of all power m...

Page 143: ...ment on PV installations by pressing the GO STOP key the same relationships described in 10 1 above apply with the only difference lying in the condition of steady irradiation for the samples detected...

Page 144: ...module s terminals and I is the current which runs in the circuit obtained by closing the module on a hypothetical charge With reference to the figure above the product V I is represented for the thre...

Page 145: ...recording all those TRMS values as voltage anomalies calculated every 10ms beyond the percentage thresholds of Voltage Reference Vref set during the programming from 1 to 30 in steps of 1 These limits...

Page 146: ...c distortion is a constant problem and should not be confused with short events such as sags swells or fluctuations It can be noted that in 1 the index of the sigma is from 1 to the infinite What happ...

Page 147: ...s at frequencies that are odd multiples of the fundamental frequency Harmonic currents affect considerably the neutral wire of electric installations In most countries the mains power is three phase 5...

Page 148: ...ontinue operating at its rated capacity when not suited to the harmonics This is necessary because the harmonic current in the neutral wire of the secondary circuit circulates in the delta connected p...

Page 149: ...inrush current event Fig 175 Parameters of oscillating inrush current event The meter detect and recording as inrush current all the events where the phase currents TRMS values are over a set limit t...

Page 150: ...g the detectable time interval value of last sample at the end of the detectable time interval Graphical window of recorded events graphic of saved 100 TRMS values of current and correspondent voltage...

Page 151: ...of this the result is that each unbalanced three phase system can be decomposed in 3 three phase systems which can be reduced to a separate study of three single phase circuits relative to direct sequ...

Page 152: ...ures of this analysis refer to the following picture where a typical voltage spike at 50Hz frequency is shown Fig 177 Typical voltage spikes at 50Hz frequency The meter continuously checks the input v...

Page 153: ...f a event Phase ID of phase where the event is occurred Date Time Date Hour in minutes seconds cents per second when the event is occurred Up Down This flag is UP if the spike is correspondent to a ri...

Page 154: ...tween voltage and current of n phase In the presence of distorted voltages and currents the previous relations vary as follows Phase Active Power n 1 2 3 I V P n k n k n k k actn cos 0 Phase Apparent...

Page 155: ...rom the electric installation 10 10 1 Conventions on powers and power factors As for the recognition of the type of reactive power of the type of power factor and of the direction of the active power...

Page 156: ...and therefore acquires a null value 1 The power factor inductive or capacitive positive or negative is NOT defined in the panel 10 10 2 Three phase 3 wire ARON system In the electrical systems distrib...

Page 157: ...AGE value of the parameter intended as arithmetic average of all the values recorded during the integration period MAXIMUM value of the parameter during the integration period harmonics excluded Only...

Page 158: ...f improper packaging Any repair that might be necessary as a consequence of service interventions carried out by unauthorised personnel Any change to the instrument carried out without the express aut...

Page 159: ......

Page 160: ...BRA Tel 55 19 3367 8775 Fax 55 19 9979 11325 eMail vendas ht instruments com br Web www ht instruments com br HT INSTRUMENTS USA LLC 3145 Bordentown Avenue W3 08859 Parlin NJ USA Tel 1 719 421 9323 eM...

Reviews: