HP ProLiant DL145 Generation 2 Server Maintenance and Service Guide
3-1
3
Diagnostic Tools
This chapter gives an overview of the diagnostics tools supported by HP ProLiant DL145
Generation 2 server. It also describes the basics of using PhoenixBIOS Software.
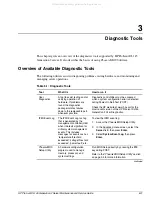
Overview of Available Diagnostic Tools
The following utilities assist in diagnosing problems, testing hardware, and monitoring and
managing server operations.
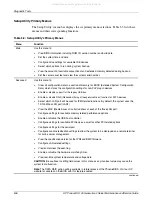
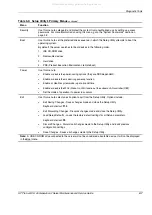
Table 3-1: Diagnostic Tools
Tool
What it is
How to run it
User
Diagnostics
A tool to assist testing and/or
verifying operation of
hardware. If problems are
found, the diagnostics
package isolates failures
down to the replaceable part,
whenever possible.
Diagnostics and utilities must be accessed
when a system configuration error is detected
during Power-On Self-Test (POST).
Check the HP website at www.hp.com for the
most recent version of the HP ProLiant DL145
Generation 2 User Diagnostics.
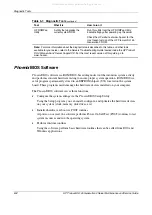
IPMI Event Log The IPMI Event Log is a log
that is generated by the
management controller (U45)
when it detects significant or
critical system management
events. This includes
messages for events such as
‘temperature threshold
exceeded’, ‘voltage threshold
exceeded’, ‘power fault’, etc.
To view the IPMI event log:
1.
Access the
Phoenix
BIOS Setup Utility.
2.
In the Advanced menu screen, select the
Server field, then press Enter.
3.
Select System Event Log, then press
Enter.
Phoenix
BIOS
Setup Utility
A hardware configuration
program used to manage
memory, processor, and
system settings.
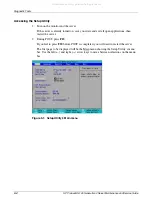
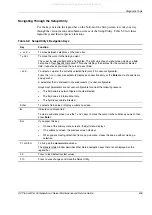
Run BIOS Setup directly by pressing the F10
key during POST.
Refer to the “
PhoenixBIOS
Setup Utility” section
on page 3-3 for more information.
continued
All manuals and user guides at all-guides.com

