DeltaMyc Operation Manual J810018 (7 Oct 2014)
Operation
3-26
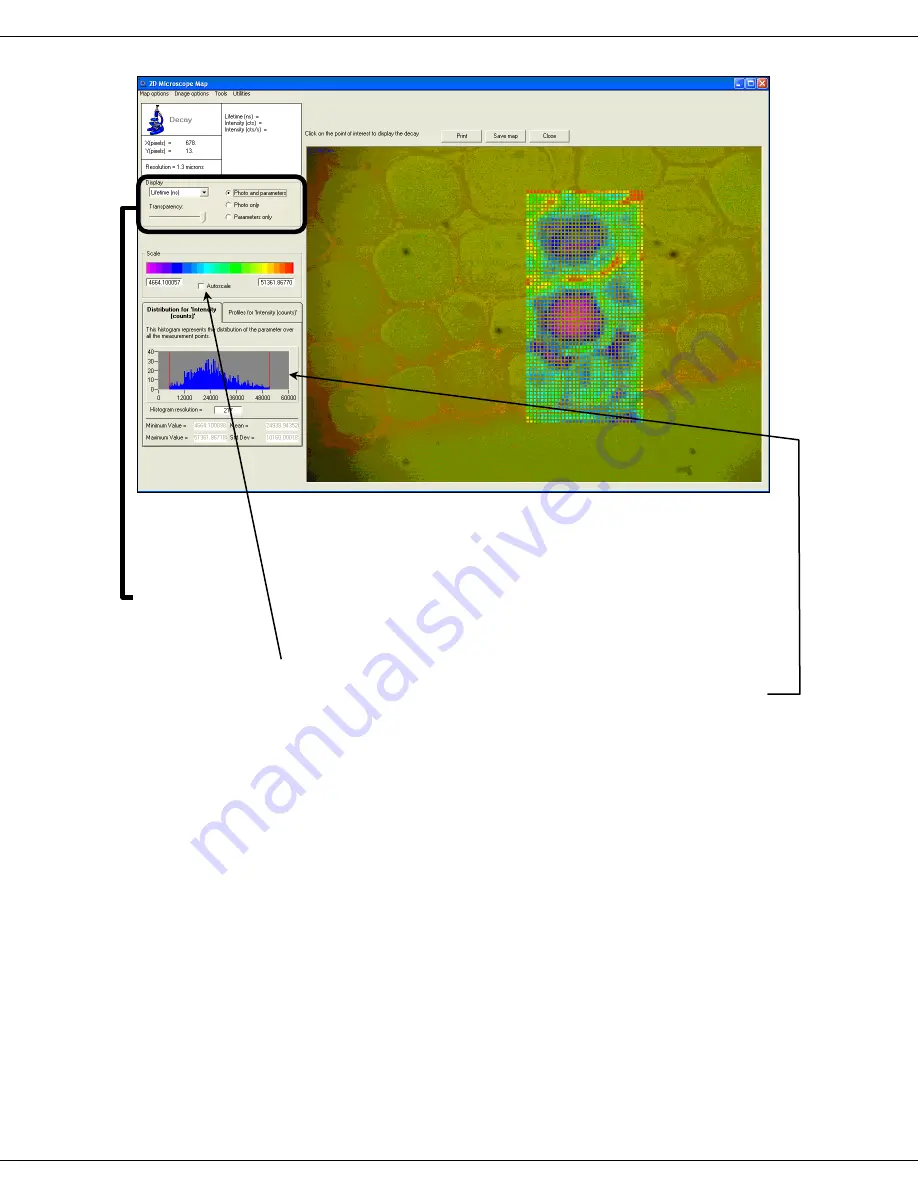
Fig. 26. The
2D Microscope Map
window.
Modify the various options to affect the display of the results on the map: in the
Dis-
play
area, select the parameter of interest from the drop-down menu, for instance
Life-
time
. In the
Display
area, select the display-type radio button, for instance
Photo and
parameters
. Change the transparency of the grid cells on the map via the
Transpar-
ency
slider.
If the
Autoscale
checkbox is not checked, you can adjust the minimum and maximum
values of the scale, by typing values in or by sliding the cursors on the histogram graph.
The histogram displays the distribution of the values across the whole map for the pa-
rameter being displayed.
To obtain more information about a particular measurement location, move the mouse
pointer to this location. The relevant data are shown in the Information section.
To display the data curve of a particular decay, click on the measurement location and
the decay curve is displayed in the main DataStation window. The corresponding decay
item is added in the measurement tree for further review. Even though not all the decay
items are shown in the tree, all the measured decays are saved in the DAS file.
The menu at the top gives access to a few more functions:
Map
options
Colour/Grey
scale
Select between color and gray scale. The intensity thresh-
old option allows you to filter out points that are not within
the defined intensity range. The color scale is applied to the
parameter to be displayed (e.g., lifetime) while the intensity
is displayed in gray levels for pixels that are outside of the
selected intensity range.


