English
61
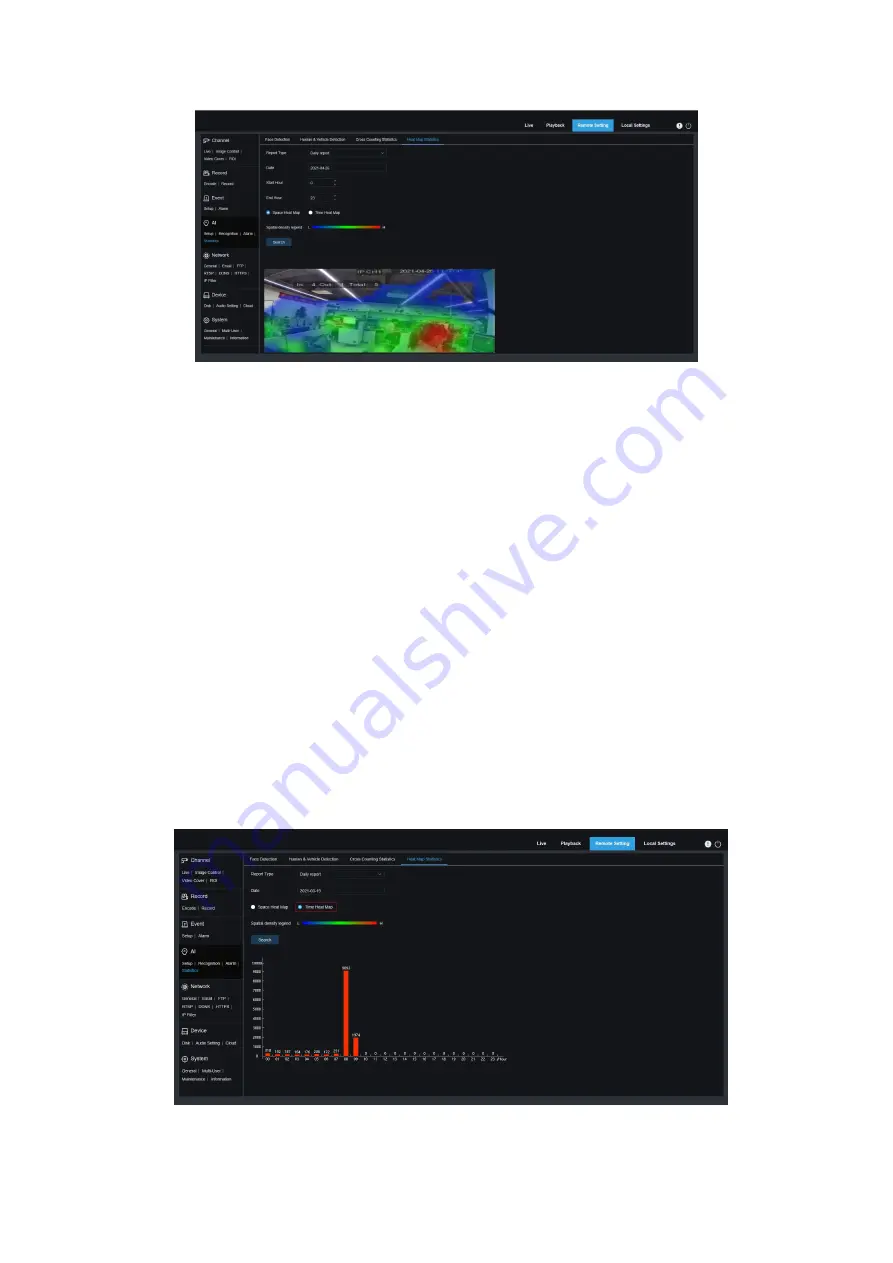
Figure 8.34-1
Report type
: including day / week / quarter / year;
Date
: select a specific date;
Start hour
-
end hour:
sets the start and end time periods.
Select the "space heat map" button and click "search", and the search results will be displayed in
pictures, as shown in figure 4-4-1. The more motion activity in the currently selected area, the
darker the color. The color shows blue to red, corresponding to light to dark.
Select the "time heat map" type and click the "search" button, and the statistical table is displayed
in a column chart at the bottom, as shown in Figure 8.34-2.
Note
:
The time heat map is a statistical of the number of targets in the current range for each frame of
data processed. Since the number has been accumulated, NVR will re normalize the data, so there
is no actual corresponding value for the data at this time.
Figure 8.34-2 Time Heat Map menu
Summary of Contents for GU-CI Series
Page 1: ...English 1 ...
Page 82: ......


