


39
Chapter 8 Recall
The monitor provides 480-hour trend data of all parameters, storage of 4800 groups of NIBP measurement results and
72 alarm events. All these data can be output through recorder. By using SD card, the trend data and 72-hour ECG
waveform can be reviewed. This chapter gives detailed instruction for reviewing these data.
8.1 Trend Graph
n
The latest 1-hour trend is displayed in a resolution of every 1 or 5 seconds;
n
The latest 480-hour trend is displayed in a resolution of every 1, 5 or 10 minutes;
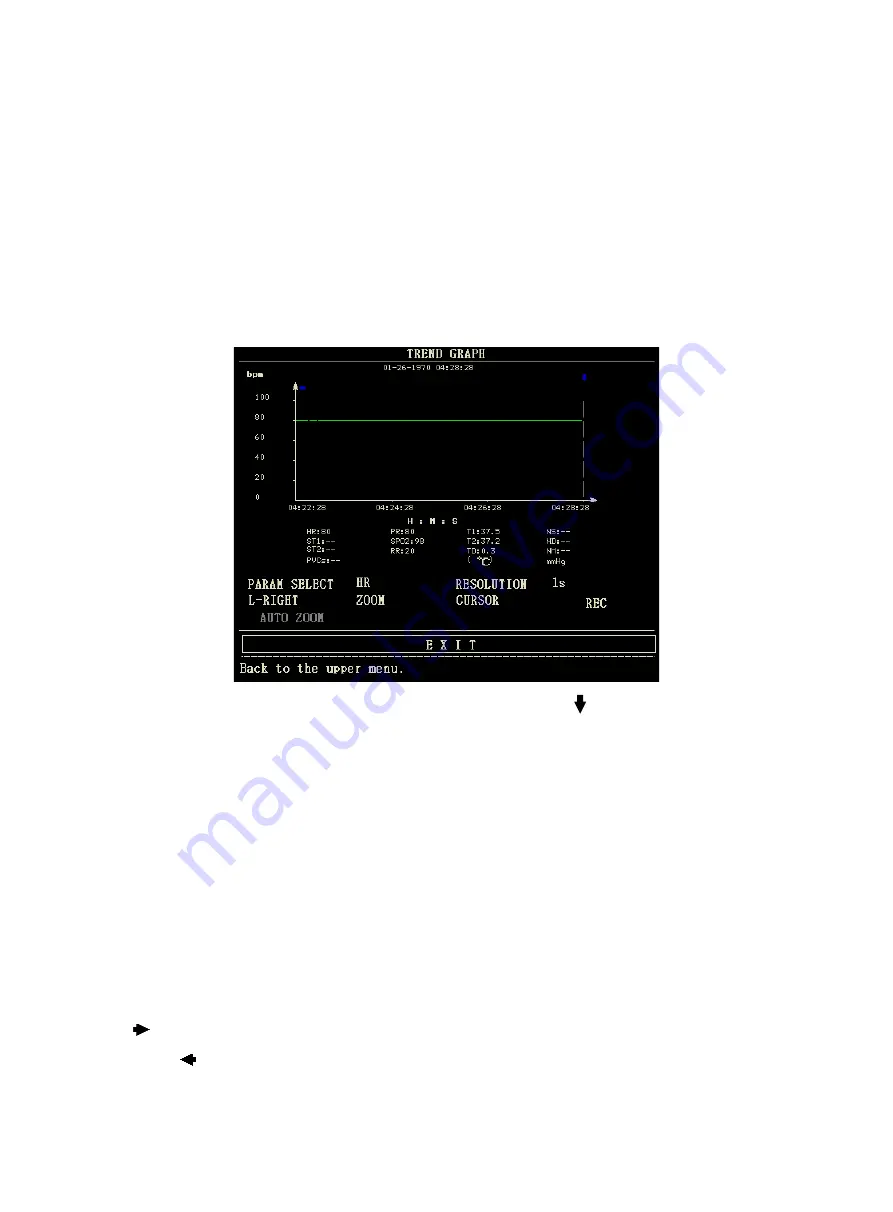
Pick "TREND GRAPH" in the SYSTEM MENU to call up the following menu:
The y-axis stands for measured value and x-axis stands for time. The symbol " " in above figure is the cursor of trend
graph. The value that the cursor points to, is displayed under the trend graph, and its corresponding time is displayed
above the trend. Other trends except NIBP trend are displayed in continuous curves. In NIBP trend graph, the symbol
"*" represents the coordinate of the NIBP value.
To select trend graph of a specific parameter:
Pick PARAM SELECT item by using the cursor, and select a requested parameter name by turning the knob, then the
trend graph of this parameter will be displayed.
To select 1-hour or 480-hour trend graph:
Pick RESOLUTION item by using the cursor, choose 1 s/5 s for 1-hour trend graph and 1min/5 min/10 min for
480-hour trend graph.
To view earlier or later trend curves:
When "
" appears on the right part of the screen, pick "L-RIGHT" button, turn the knob clockwise to view later trend
curves. When "
" appears on the left part of the screen, select the "L-RIGHT" button, turn the knob counterclockwise
to view earlier trend curve.


