GeminiBio MXG102 User Manual Download Page 24

Moxi GO II

 User Guide


Page 19 


 “Cell QC” Test  

The “Cell QC” app is designed to provide simplified analysis of cell viability samples either one 
test at a time or in batch mode (rapid acquisition of multiple samples of the same cell type, using 
consistent gating).  The initial display output of the Cell QC app is a simplified, list of the sample 
statistics, based on the system’s auto-gating of the sample.  The batch mode, in-addition to 
providing for rapid acquisition of data, provides the same simplified output for each test, along 
with a final summary .csv (e.g. Excel) output file with the summary data for all tests.   

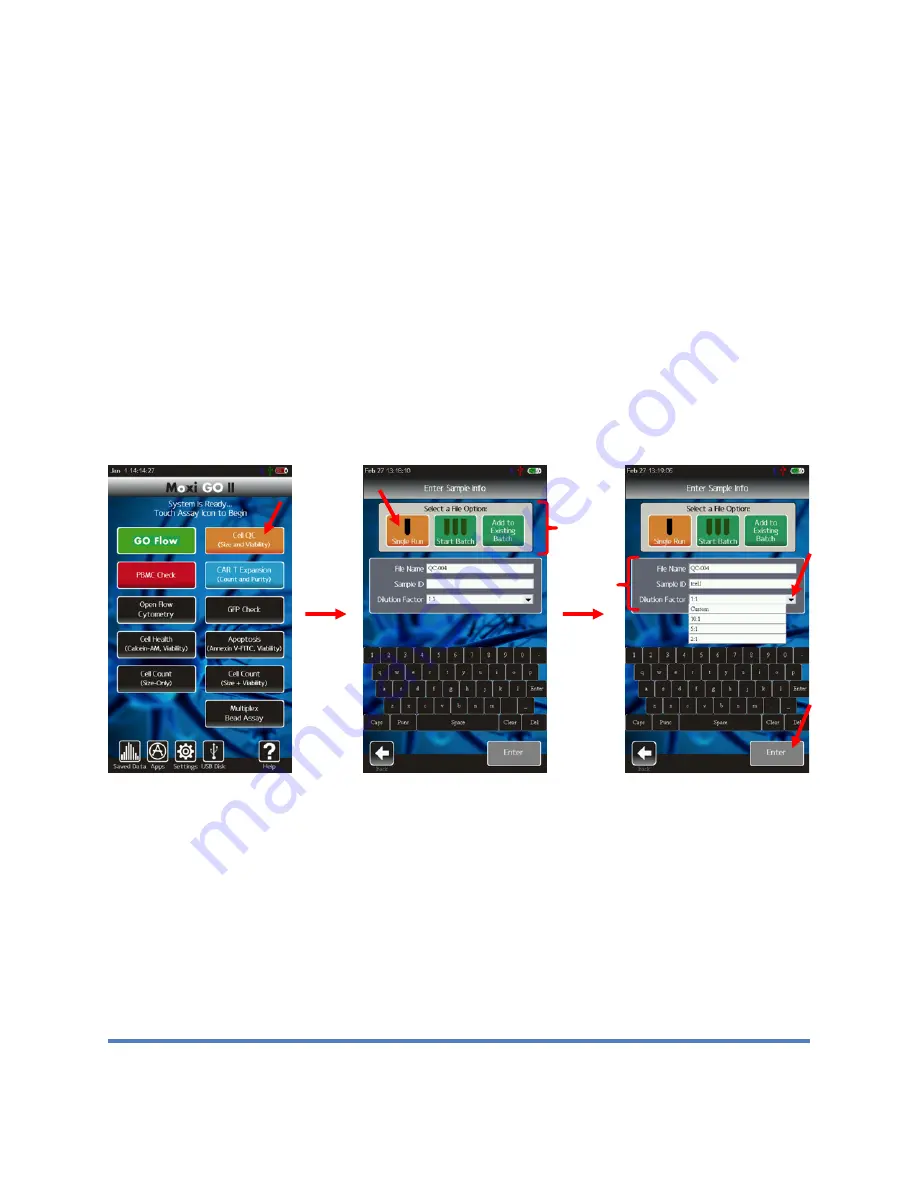
Touching the “Cell QC” icon on the Home screen brings up the Cell QC “Enter Sample Info” 
screen.  The first selection option is the “File Option”. There are three file options:  1.) “Single 
Run” (run a single test). 2.). “Start a Batch” (run a series of samples of the same type in rapid 
succession) 3.) “Add to Existing Batch” (continue running a series of samples in batch mode, 
appending to an existing batch run).   The selected option is display in orange.  The other 
options in green.   

Cell QC – Single Run 

By default, the system sets the “File Option” as a “Single Run” (single test, see image 
above/middle).  Below the file option selection, there are three test parameters that the user can 
set:  1.) “File Name” 2.) “Sample ID” and 3.) “Dilution Factor”.  The system defaults the test to 
have a name of “QC-XXX” where XXX is a sequential number starting at “000” and incrementing 
with each test run.  The system will auto-enumerate that number with the lowest available 
number (not already used by a saved test on the disk).  This value also provides the test file 
name (with an .fcs extension, e.g. “QC-004.fcs”).  This file name field can be changed by 
touching in the box and using the keyboard below to type a new name.  

Notes:  1.) Capital 

letters can be typed by hitting the “CAPS” key to change the keyboard to capital letters.  2.)  
Additional punctuation/symbols are available by touching “Punc”.

   The “Sample ID” field can be 

used as general text description of the sample being run.  This field can be changed by touching 

Summary of Contents for MXG102

Page 1: ...For Research Use Only Not For Use In Diagnostic or Therapeutic Procedures a subsidiary of Moxi GO II USER GUIDE...

Page 2: ...ware in violation of any applicable laws orders or regulations Disclaimer The information in this document is subject to change without notice and should not be construed as a commitment by Orflo Neit...

Page 3: ...EST 13 General Instructions All Tests except Cell QC Open Flow and Multiplex Bead Assay 13 Inserting a Cassette 14 System Calibration 14 Loading a sample 15 Open Flow Cytometry Test 16 GO Flow Tests S...

Page 4: ...45 Web or Quadrant Gating Fluorescence vs Fluorescence Scatter Plots 46 Store and Recall of Gate Settings 47 Histogram Overlays on Fluorescence vs Size Scatter Plots 48 Size Histogram Assay 48 Changi...

Page 5: ...ENTS AND ORDERING INFORMATION 71 REMOVING AN EXISTING INSERT 72 INSTALLING AN INSERT 74 TROUBLESHOOTING 76 MAINTENANCE AND STORAGE 80 SPECIFICATIONS FOR THE MOXI GO II AND CASSETTES 83 ORDERING INFORM...

Page 6: ...loaded to a PC or Mac via USB connectivity IMPORTANT NOTE The Moxi GO II is intended for research use only Not for use in diagnostic procedures It is not intended for use in medical diagnostic or ther...

Page 7: ...DICATED THROUGHOUT THE USER GUIDE BEFORE OPERATING THE SYSTEM Electrical Safety WARNING To avoid the danger of electric shock including the possibility of permanent injury or death Prior to use verify...

Page 8: ...ssemble or service the Moxi GO II to service or adjust the laser The instrument has no user serviceable parts and attempts to adjust or service the laser may result in hazardous radiation exposure All...

Page 9: ...assettes the extra 646nm LP filter a spare cassette tray insert and a Quick Start Reference Guide The following figure shows the main visible components of the Moxi GO II and the table provides a desc...

Page 10: ...e latches cassette into position for acquisition USB Cable Port Connects instrument to USB cable Swappable Optical Modules Custom optical detection filters for testing with various dyes fluorophores C...

Page 11: ...t that matches the rating of the Power Adapter CAUTION Use only an ORFLO supplied USB Cable and Power Adapter Use of other products may result in inaccurate test results or damage to the instrument an...

Page 12: ...Alexa Fluor 488 BB515 GFP Calcein Acridine Orange BODIPY 500 510 Rhodamine 110 561nm LP PE PI PE Cy5 PerCP Cy5 7 AAD PerCP DsRed 646nm LP PI 7 AAD PE Cy5 For assays other than Open Flow Cytometry and...

Page 13: ...the Home Screen Home Start Screen NOTE The home page appearance may change as additional applications are launched and new GUIs graphical user interface buttons are added to the Moxi GO II software p...

Page 14: ...Moxi GO II system certain assays applications may be disabled examples in images below These assay can be enabled by contacting Orflo Gemini info orflo com 855 879 6694 Assays Applications Grayed out...

Page 15: ...field Use the up down arrow keys to change the values Passcode Lock The Moxi GO II can be setup to require a password login to use the instrument and access stored data To set the Password lock select...

Page 16: ...try and GO Flow assays by touching the value on the test start screen as described in Running a Test Open Flow Cytometry Test section step 6 Auto Noise Find This field sets the behavior of the system...

Page 17: ...s While the Type S and MF M Cassettes do have a pre filter for removing sporadic large particles cell samples should be prepared as single cell suspensions to avoid clogging of cassettes Clusters aggr...

Page 18: ...st General Instructions All Tests except Cell QC Open Flow and Multiplex Bead Assay Please follow sample preparation guidelines above Sample Preparation Considerations in preparing the sample Note The...

Page 19: ...or Invalid Cassette error message System Calibration The system will automatically perform a calibration step as outlined in the images below The automated sequence aligns the laser to the cassette fl...

Page 20: ...a 60 75 L sample Enter the Sample image below middle into the fill port of the cassette either test 1 or test 2 depending on which end of the cassette was inserted into the instrument and close the D...

Page 21: ...nds if no fluid is detected Once the fluid is detected the system message changes to Counting and the results are dynamically populated on the scatter dot plot Results for most samples will be complet...

Page 22: ...rd image below right and select Next Notes a Any combination none only one or both of the channels can be selected for recording b These channels will not be displayed during sample acquisition but ca...

Page 23: ...GO Flow app is meant to simplify expedite the Open Flow Cytometry selection process by automatically selecting the PMT1 525 45nm channel as the Display channel and the PMT2 Long Pass either 561nm LP o...

Page 24: ...a series of samples in batch mode appending to an existing batch run The selected option is display in orange The other options in green Cell QC Single Run By default the system sets the File Option...

Page 25: ...in running sample batches With batch testing there are three test parameters that the user can set 1 Batch Name 2 Sample ID and 3 Dilution Factor The system defaults the batch name to have the format...

Page 26: ...is shown the raw scatter plot data image above left and given the option by touching the orange rectangle to manually adjust the system s auto gate placement Touching the orange rectangle will bring t...

Page 27: ...ct representation of the Results Summary screen Touching the Save button for a Single Run Cell QC test will save the data FCS format and will return the system to the Home Screen For Batch Runs the sy...

Page 28: ...ted screenshot files and the batch summary file Batch_summary csv file An example screenshot of a Batch_summary csv file opened in Microsoft Excel in this case is shown above The summary file contains...

Page 29: ...urrent State The Moxi GO II has an assay app that was designed for providing relative comparison of MFI levels protein expression e g cytokine levels for two lysed cellular samples At this point the k...

Page 30: ...be compared to it When developing a custom multiplex assay it is necessary to contact Orflo Technical Support tech_support orflo com 855 879 6694 to get a firmware file setting to correspond to the nu...

Page 31: ...moving the columns in a way that removes beads from falling into the detection lanes is shown in the image above bottom left Note for that screenshot that there are only two red dotted clusters only...

Page 32: ...power on of the system to Use the Prior Reference Selecting the Saved Test will bring up a file listing with only the saved Multiplex Assay References tests showing see image below top right Touching...

Page 33: ...an be accessed from the Saved Data area After selecting Saved Data from the Home screen the user can tap one of the Plex XXXC FCS files to open a particular reference test Image below above left Openi...

Page 34: ...Moxi GO II User Guide Page 29 linked with that reference file Touching any one of those files will bring up the data table comparison image below bottom left for those files...

Page 35: ...mately based on the gating of the raw data displays Even with the simplified tests the user always has the option to view review the raw data and adjust the gates if needed The raw data can be display...

Page 36: ...t Fluorescence vs size Histogram overlay toggle Upper gated region Above red line statistics results Next button to progress through screen workflow Store recall gate locations in memory pre sets Sele...

Page 37: ...ted above red Line defined in PMT vs Size view pop results Lower Upper overlap Region yellow Fluorescence scale PMT output in mV with logicle scaling Lower gated red text shows below red line compensa...

Page 38: ...region of PMT vs size display Tap blue maker and then touch anywhere around Blue marker Drag to Move center of marker Fluorescence Level Of PMT mV for each channel axis Total cell count Quadrant 3 Lo...

Page 39: ...that is based on a precise volumetric measurement Coulter Principle combined with a spherical assumption particle volume Coulter Principle measured and median fluorescence intensity MFI values for th...

Page 40: ...cluded in the box are particle concentration cells ml MFI s displayed as x axis MFI y axis MFI and percentage of total counts in yellow The total counts for all four quadrants is provided in the black...

Page 41: ...ree of red blood cell RBC contamination red box image above This value is calculated as the cell counts in the range of 5 m to 6 2 m corresponding to the region where RBC s would be expected The user...

Page 42: ...positions dashed red arrows image above right are displayed The range of the RBC gate can be adjusted by touching and dragging the blue icon more detail in the Manual Gating PMT vs Size Gating section...

Page 43: ...ot is display above middle The placement of the size gates blue markers vertical lines two top dashed red arrows in image above middle and fluorescence gate horizontal red line two lower dashed red ar...

Page 44: ...ate for the initial test run with any new sample cell types Once verified the user can simply refer to the simplified test output screen The user can return to the simplified output summary screen by...

Page 45: ...lowing gating of the PMT vs PMT quadrant view example in image above left for an apotosis assay the user has the option of touching the Summary button This button brings up a table and bar chart outpu...

Page 46: ...the optimal range Next the analysis region is set by adjusting the blue size gates Following that the red fluorescence gate can be adjusted to distinguish the fluorescence positive vs fluorescence ne...

Page 47: ...s not lost during the rescale process 1000 histogram bins This allows and is recommended for users to achieve finer resolution of smaller particle populations and potentially increased separation betw...

Page 48: ...r to adjust the fluorescent threshold to determine which events will be included in the positive vs negative designations for the display fluorescence channel Each gating mode will be discussed in fur...

Page 49: ...ed Events to the left of the left size gate and to the right of the right size gate are not included in the count totals or population percentages e g Live Cell The total particle count in the size ga...

Page 50: ...low the control respectively storing the gates locations see section on storing recalling gates and then recalling the gates for the standard labeled sample Noise Gating of Scatter Dot Plots Touching...

Page 51: ...unadjusted at the system specified noise exclusion setting Web or Quadrant Gating Fluorescence vs Fluorescence Scatter Plots In analyzing tests with two recorded fluorescent channels it is usually des...

Page 52: ...also allows the user to store up to five gate locations in memory for recall A given set of gate settings can be saved by hitting the STO RCL button arrow in image below left Doing so brings up a list...

Page 53: ...togram Assay For samples that lack any staining or fluorescent label quick counts and particle sizing information can be obtained by running a Size Histogram assay As the laser is not used with this a...

Page 54: ...on limit of the system cassettes some inherent system noise is inevitably present To help identify this noise the counts in this region are automatically grayed out by the system In size only mode an...

Page 55: ...or individually with a histogram only view The change the display axis the X Y button image below frame at the top right can be selected When X Y is pressed the available channels for each axis are di...

Page 56: ...above bottom left frame Displayed by selecting PMT2 at the top and Size at the right Note The fluorescence channel being displayed is identified by the red box at the top left of the scatter plot 525...

Page 57: ...nd Test Name fields To change the name on the Moxi GO II touch the green test name box at the top of the scatter plot or histogram see image below left The default name is presented and can be deleted...

Page 58: ...y When saving the raw data scatter plot view for those tests a _scatter bmp extension is used so that it does not overwrite any screenshot of the simplified view The screenshot will be an exact pixel...

Page 59: ...of the screen Touching the same icon e g Name repeatedly reverses the sort order ascending vs descending Test files and screenshot files can be opened by simply touching the green or dark gray row An...

Page 60: ...ck to green indicating the compare option is viable The criteria for comparing two tests is as follows The tests need to be of the same assay type e g Open Flow Cytometry Viability etc Only two tests...

Page 61: ...oxi GO II User Guide Page 56 icon or File Save icons The overlay is then available as a blue comma separated value CSV file entry in the Saved Data area see image above bottom left example Ovl 002 CSV...

Page 62: ...opidium iodide PI viability dye emission In this regard it is ideal for use when using a PI counterstain However the 646nm LP filter is pushed too far out for Phycoerythrin PE detection So when using...

Page 63: ...es The only points displayed on this view are the points that were size gated between blue markers on the PMT vs size graph image below top left In the vast majority of cases spillover will occur from...

Page 64: ...ster on the displayed test it is possible to use a negative control test as the control Please see the Compensation with Negative Control Load Control Set section below Once the Control and Spillover...

Page 65: ...th the value shown in red text after the axis label see red box in image above bottom right Also note the relative shift in the spillover cluster position as well as the yellow box DMFI value in the i...

Page 66: ...ication of the spillover effect In this case the user can touch the Load Control Set button to select a previously run negative control data set to use The system will display the full Saved Data list...

Page 67: ...e scatter plot view The last saved compensation levels for any particular assay type e g Open Flow Cytometry GO Flow Cell Health GFP Check etc are also stored by the system The user can then automatic...

Page 68: ...Moxi GO II User Guide Page 63...

Page 69: ...r each test and the files are named with the test name followed by a fcs extension e g Via 001 fcs Quantitative fluorescence values fluorescent assays and size values all tests are saved within the fi...

Page 70: ...as a flash drive e g E If the Moxi GO II is not physically connected to the computer you will receive a message USB Connection Please connect a USB cable to a PC host first i Once connected the compu...

Page 71: ...t connection The Connected light will go dark images above left to above middle iii Touch the I have Ejected or Safe Disconnected at the host PC button The system will return to the Home Screen image...

Page 72: ...on of the Moxi GO II OS being run on the unit the build date as well as the Bluetooth ID number see image to the right This information is required by ORFLO Technical Support when assisting users with...

Page 73: ...OS loader mode Restart Reboots the unit Off powers the unit off Migrate Used to migrate pre v2 10 firmware data from old 16Mb flash disk to the new 4Gb SD disk This should be done immediately followi...

Page 74: ...the text appears The loader mode is shown in the image to the right top 5 The Moxi GO II will appear as an external drive on the computer look for it in the Windows Explorer as External Disk Drag all...

Page 75: ...Moxi GO II User Guide Page 70...

Page 76: ...rt that has the adhesive build up replacing it with a new insert System Requirements and Ordering Information The new cassette tray design that accepts the disposable inserts must first be installed b...

Page 77: ...system before starting this procedure Leaving it in place can result in damage to both the cable and the system when the system is being tilted back connectors can break 1 With left hand push down on...

Page 78: ...he center tab red arrow in images below of the tray insert while pulling out to slide the insert out Pull insert all the way out Once out the tray lever can be released Refer to images below Note If s...

Page 79: ...s can break 1 Using your left hand push slightly down on the tray lever NOT ALL THE WAY 1 3 depressed for the cassette tray 2 Place back of the insert to the tray and align the insert rails with the t...

Page 80: ...he black top mount in the system see image below right If the tray doesn t close and there is a gap see image below left push gently on the tray lever and try to push the insert further in 4 To double...

Page 81: ...for at 10 seconds System should shut off on release of the button Try powering on the system after that If problem persists return instrument for service No Clear Scatter Dot Plot clusters or smearin...

Page 82: ...clusters ORFLO recommends Accutase or equivalent Improper Size Gating Please refer to the Managing the Data or Gating the Data section for instructions on gating The noise debris cluster in the bottom...

Page 83: ...rument by pressing and holding the power button for at least 5 seconds When plugging the system into a computer to access the data the system may report a crash log has been generated Email that file...

Page 84: ...filter and blocking flow Try breaking apart cells using pipette trituration and or protease treatment Test Error Stop Detected before Start Used cassette or cassette error Try the other side of the ca...

Page 85: ...and Cassettes at room temperature in a dry environment For best results cassettes should be used within one year of purchase Avoid prolonged exposure to ultraviolet light as it may degrade the touch...

Page 86: ...d in When unplugged the level of fill of the battery icon will be proportional to level of charge of the battery e g a 50 charged system will show a half filled battery icon when unplugged The battery...

Page 87: ...o routine maintenance required for the Moxi GO IITM In addition there are no user serviceable parts with the exception of the ability to swap out the tray insert see instructions above Instrument repa...

Page 88: ...nd other offline software analysis platforms Measurement Modes Open Platform Assays Protocols Yes Open Flow GO Flow Applications available allowing users to define their own protocols and analysis Req...

Page 89: ...5 8 in x 9 3 in x 8 7 in 14 8 cm x 22 1 cm x 23 6 cm 10 lbs 4 54 kg Electrical Specifications Internal Battery AC Power Adapters US EU and UK types Rechargeable 3 7V 7500 mAh lithium ion Input 100 240...

Page 90: ...tes 25 pack MXC030 Type S Cassettes 250 pack MXC032 MF M Cassettes 25 pack MXC021 MF M Cassettes 250 pack MXC023 Moxi GO II USB Cable and Adapter MXA120 Moxi GO II 488 Optical Filter Module 525 45 MOG...

Page 91: ...rements our standard product warranties remain in effect for two 2 years in EU countries What is Not Covered by Your Warranty The following exclusions apply to your ORFLO warranty Damage resulting fro...

Page 92: ...or written which are inconsistent with this warranty or such publications are not authorized and if given should not be relied upon ORFLO Technologies shall not be liable for consequential incidental...

Page 93: ...Moxi GO II User Guide Page 88 A subsidiary of...

Reviews: