


Fluke 19xC-2x5C
Users Manual
68
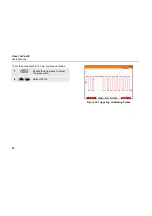
Reading the Screen
The bus test screen (see the example Figure 35 ) shows
the status of the various signal properties.
Information is represented in five columns:
A.
signal property that is being tested, for example
V-Level Bias
. See page 70 for a description of the
tested signal properties for each bus.
B.
status indicator, for example
description of the indicators.
C.
most recent measurement value, for example
3.5
.
---
indicates that no reading is available
OL
indicates that the signal is out of the
measurement range (overload)
D. Min
Max
: the lowest and highest measured value
E. Limit
: used low (left) and high (right) test limits, for
example
18.5 31.6V
.
LIMIT *
the
*
indicates that one or more of the
limits are not set to the default value!
N/A
indicates that limit does Not Apply to this
bus type.
The F1…F4 function key labels are explained in Table 2.
Figure 35. Field Bus Test Screen Example
A B C D E
Summary of Contents for 19xC
Page 2: ......
Page 9: ...Contents continued v A Bushealth Measurements A 1...
Page 10: ......
Page 36: ...Fluke 19xC 2x5C Users Manual 26...
Page 60: ...Fluke 19xC 2x5C Users Manual 50...
Page 110: ...Fluke 19xC 2x5 Users Manual 100...
Page 146: ...Appendices Appendix Title Page Bushealth Measurements A 1...
Page 147: ......


