3 Quick Start
3.3 Basic measurement methods
24
3.3 Basic measurement methods
Basic operation examples
…………………………………………………………………………24
3.3.1 Basic operation examples
This section introduces details steps of common and important basic settings and functions of the 3943B
monitoring receiver with examples to help the user rapidly know the characteristics of the instrument and
understand basic measurement methods.
3.3.2.1 Measurement of sinusoidal signal
The most common measurement task of the monitoring receiver is to determine level and frequency of a
signal. In this section, the output signal of the synthetic signal generator is used as an input to introduce
how to measure a simple sine wave signal. For example, in order to measure the sinusoidal signal at
1GHz, the following steps can be performed:
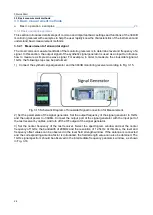
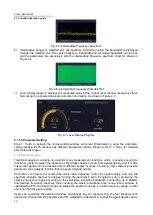
1) Connect the synthetic signal generator and the 3943B monitoring receiver according to Fig. 3.15.
Fig. 3.15 Schematic Diagram of Sinusoidal Signal Connection for Measurement
2) Set the parameters of the signal generator. Set the output frequency of the signal generator to 1GHz
and the output power to -30dBm. Connect the output port of the signal generator with the input port of
the test receiver by cables, and turn off the RF output of the signal generator.
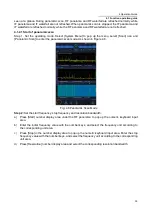
3) Set the center frequency of the test receiver. Select the spectrogram window and set the center
frequency of 1GHz, the bandwidth of 20MHz and the resolution of 12.5kHz. At this time, the level and
frequency offset values can be observed in the level field strength window. If the antenna is connected
and the corresponding antenna factor is introduced, the field strength value can also be obtained. The
1GHz signal spectrum should be observed in the intermediate frequency panoramic window, as shown
in Fig. 3.16.


