8 Technical indicators and testing methods
8.5 Performance characteristics test
108
1)
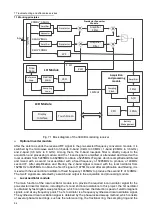
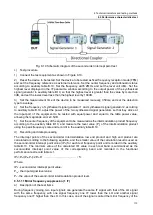
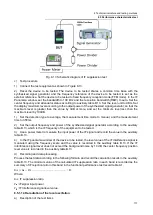
Connect a 50Ω load to the RF input port of the device to be tested in accordance with Fig. 8.5.
2) Reset the device to be tested. Set the device to be tested to fixed frequency reception mode (FFM).
Set the level unit to dBm. Set the demodulation bandwidth to 1 kHz and the detection method to average.
In the IF panorama window, set the measurement time mode to manual and the measurement time to
2s.
3) Set the test frequency and attenuator status according to auxiliary table B.5. The noise level values
are read in the Level Field Intensity window and recorded in the auxiliary table B.5. If the remaining
response frequency point is encountered, the test frequency should be fine-tuned to deviate from the
remaining response frequency point.
d) Test record and data processing
Process the data in Table B.5 according to the following formula, and record the calculation results in the
auxiliary Table B.5 and summarize them in the functional performance test record Table A.1.
BW
P
NF
log
10
174
.......................................
(
2
)
Where:
NF - is the noise factor.
P - is the noise level value.
BW - is the demodulation bandwidth.
8.5.1.6 Phase noise
a) Description of the test items
Measure the reference sine signals at +10kHz, -10kHz, +100kHz, and -100kHz off the carrier. The phase
noise index at each frequency deviation of the reference sinusoidal signal is at least 6 dB higher than
that of the device to be tested. During the test, if there is a parasitic response at the set frequency offset,
the parasitic response should be rejected and measured near the frequency offset.
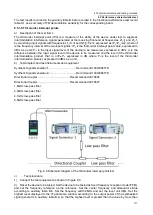
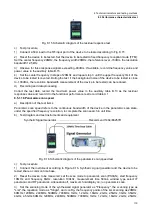
b) Test diagram and test instruments and equipment
Synthetic Signal Generator ...................................... Recommend 1464/E8257D
Fig. 8.6 Schematic diagram of phase noise test
c) Test procedure
1) Connect the test equipment according to Fig. 8.6, the device to be tested and the synthesized signal
generator common time base.
2) According to the auxiliary table B.6 set the output frequency of the synthesized signal generator in
turn, power -30dBm.
3) Reset the device to be tested. Set the equipment to be measured as fixed frequency reception
mode (FFM); set the external reference; set the center frequency, frequency width, resolution bandwidth
in order according to auxiliary table B.6; set the detection type average, filter selectivity for narrow; set
the measurement time mode to manual, measurement time 2s; open the peak frequency scale function,
open the relative frequency scale function, and set the relative frequency scale to +10kHz, -10kHz,
-100kHz, -100kHz in order. +100kHz, -100kHz. The relative frequency scale values are read and

