SC310
User’s Manual
33
•
Continuous equivalent sound-pressure level with T integration time for octave bands
centred on frequencies 31.5, 63, 125, 250, 500, 1000, 2000, 4000, 8000 and 16000 Hz
(without frequency weighting).
•
Overall continuous equivalent sound-pressure level with T integration time and frequency
weightings A, C and Z.
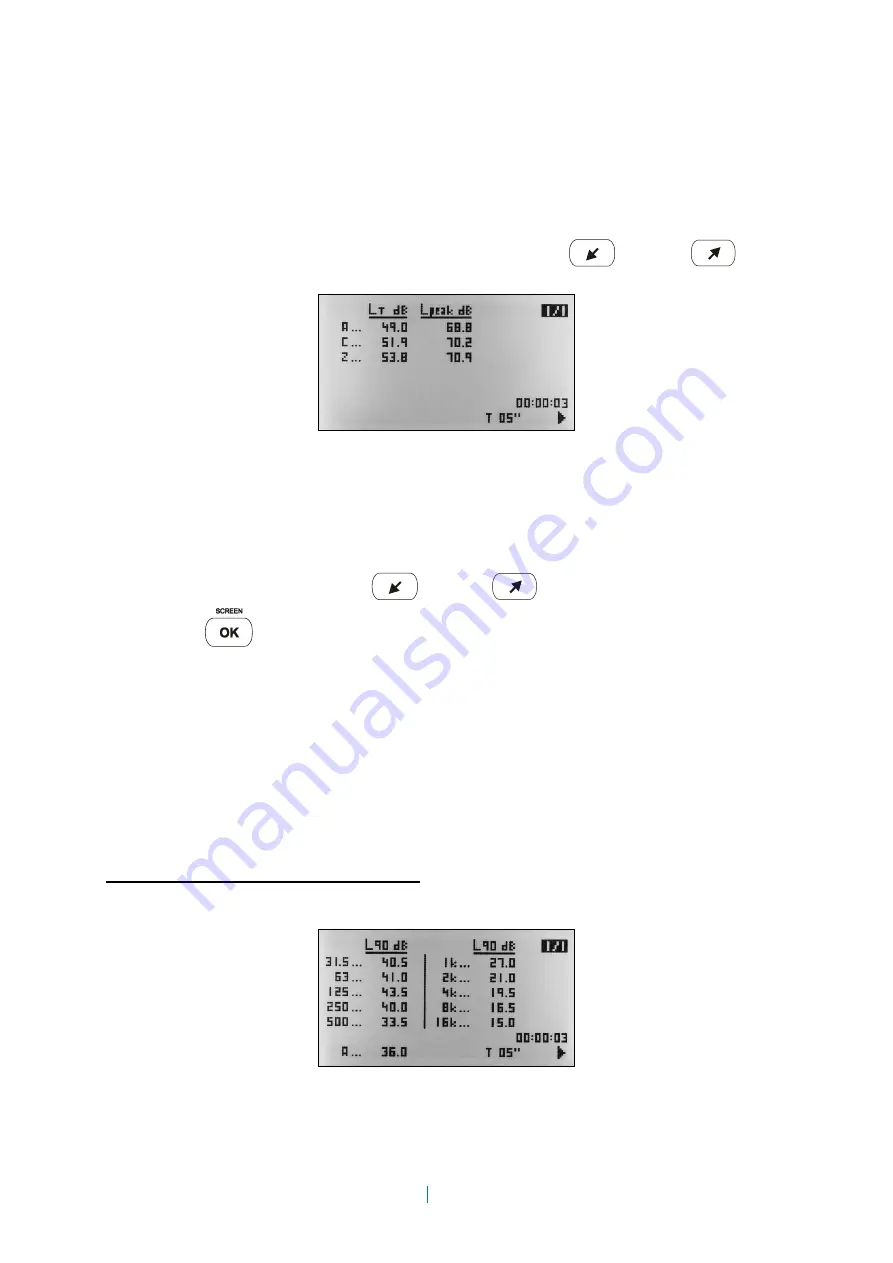
This screen displays also the following data in real time (press
(left) or
(right)
to view it)
•
The equivalent continuous overall sound pressure level with T integration time and with
frequency weightings A, C and Z.
•
The maximum of the peak sound pressure level of the T integration interval with frequency
weighting (A, C and Z).
To select the percentile press press
(left) or
(right)
By pressing
you access the statistical spectrum analyser 1/1 screen.
NOTE: The overall sound-pressure levels with frequency weightings A, C and Z are values measured by
the sound level meter. They are never calculated by applying the discrete coefficients that these filters
define to the values measured by octave band. Indeed, if they were thus calculated, appreciable
differences would be observed. Frequency weighting filters are filters continuous in frequency, while the
use of coefficients by bands is merely an approximation to them.
Regarding the Z filter, remember that it has a zero value from 10 Hz to 20 kHz. Consequently, when
measuring spectrums with a high spectral content in the low frequency (between 10 and 20 Hz), it may
happen that the energy sum of the values measured by octave bands differs from the overall value
measured with frequency weighting Z.
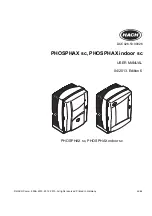
Statistical spectrum analyser 1/1 screen
This screen displays the following information in real time:
•
Percentile selected (top right-hand corner of the screen) from among L
1
, L
5
, L
10
, L
50
, L
90
,
L
95
and L
99
.


