SC310
User’s Manual
101
To change the chosen FFT line (bar ) press
(left) and
(right).
By pressing
you access the FFT narrow band frequency analysis with an interval of
visualization x 2.5.
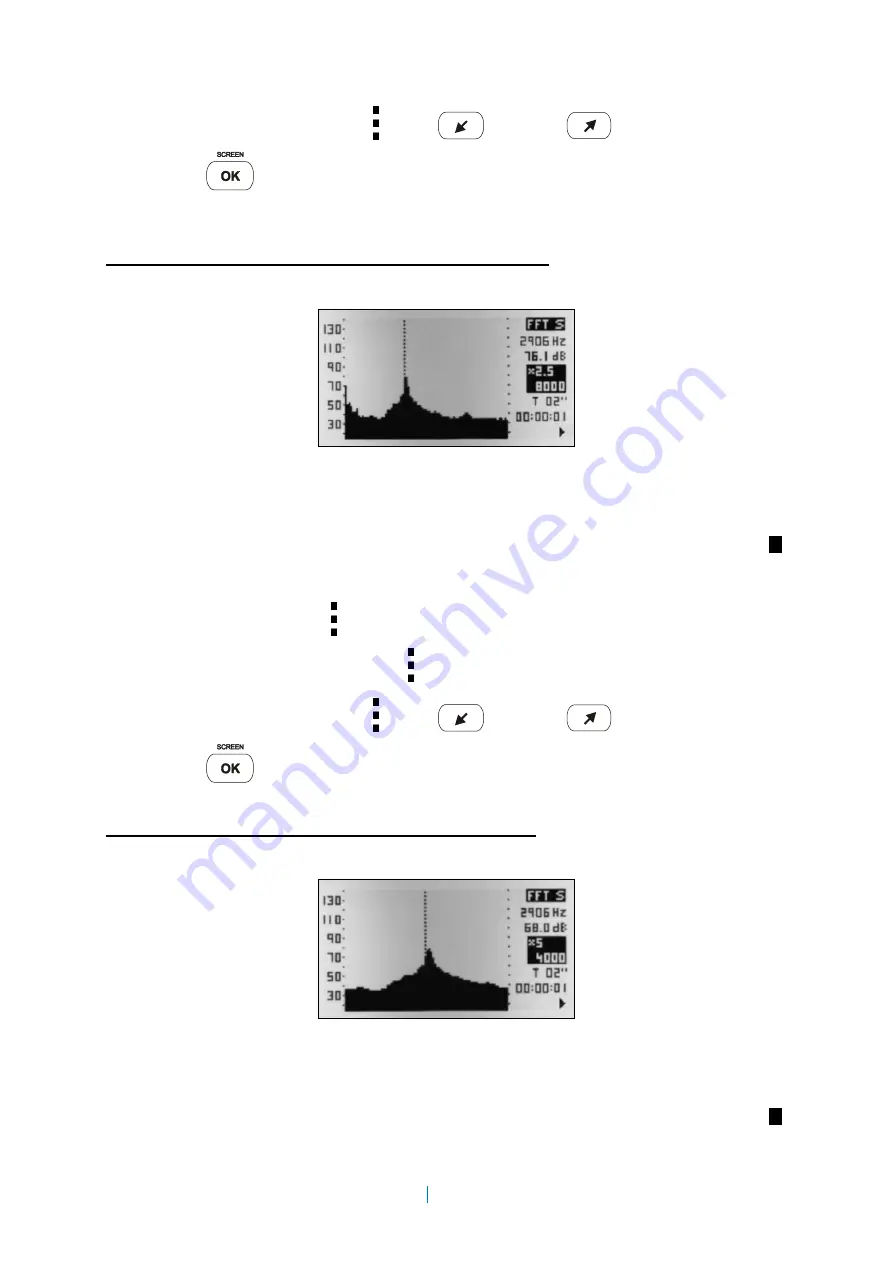
Graphic FFT narrow band frequency analysis, zoom x2.5
This screen displays the following information in real time:
•
The displayed frequency range appearing on the screen is 8 kHz. The major value of the
line from each group of 5 lines of the analysis is showed (the frequency analysis consists
on 430 effective lines and 86 lines of visualization).
•
Graph of the continuous equivalent sound-pressure levels with integration time T (bars )
in real time.
•
Numerical value of the continuous equivalent sound-pressure level with integration time T
for the chosen FFT line (bar ) (without frequency weighting).
•
Frequency of the chosen FFT line (bar ).
To change the chosen FFT line (bar ) press
(left) and
(right).
By pressing
you access the FFT narrow band frequency analysis with an interval of
display x5.
Graphic FFT narrow band frequency analysis, zoom x5
This screen displays the following information in real time:
•
The displayed frequency range appearing on the screen is 4 kHz. Each line of the analysis
is showed (the frequency analysis consists on 430 effective lines and 86 lines of
visualization).
•
Graph of the continuous equivalent sound-pressure levels with integration time T (bars )
in real time.


