3.6 Viewing PC log files
After one or more PC log files have been created, the logs
may be viewed by using PanaView as follows:
1. You can access PC logs in two ways:
• From the
new meter browser
in PanaView, expand the
network tree and click on the
PC logs
option. If you
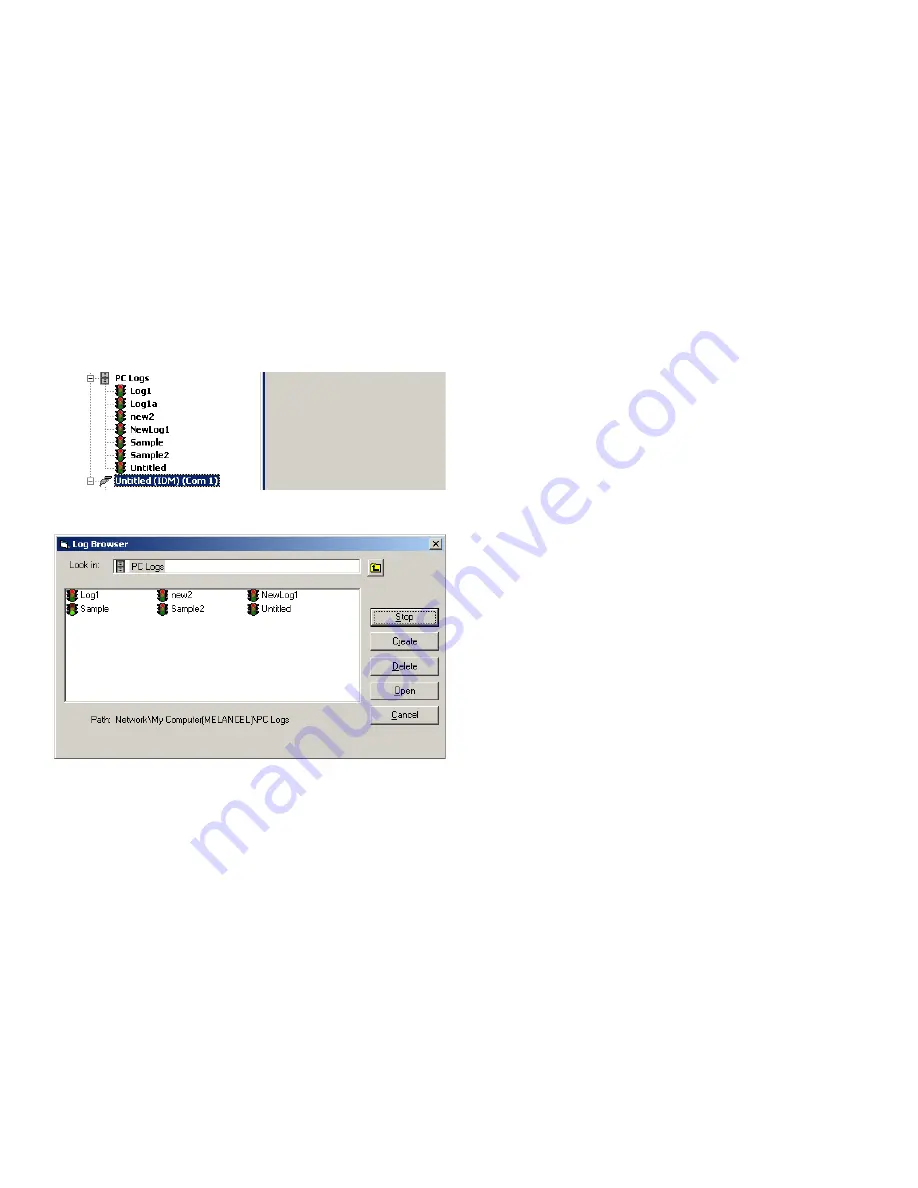
have created one or more logs, the tree will appear
similar to
Figure 22
below. Double-click on the log
name to open the log, or
• Pull down the
output
menu (see
), and click on the
log browser
option. advance
to the
PC logs
dialog box as described in previous
sections. A screen similar to that shown in
Figure 23
appears.
Figure 22: Expanded PC logs option
Figure 23: Selecting a log file from the log browser
Notice that each of the log files in
Figure 22
and
Figure 23
has a traffic light icon next to its name. These icons indicate
the current status of the log as follows:
•
Red light
- log has not run to its specified stop time but
has been manually stopped
•
Green light
- log is currently running but is not yet
complete
2. In the log browser, after you highlight the name
of the desired log file, the following option buttons
become available:
• [Start] - resumes logging if the log is currently stopped,
or [stop] - stops logging, if the log is currently running
• [Delete] - permanently deletes the log file
• [Open] - opens the log in the
PC log
window
3. Click on one of the option buttons listed in step 2 above.
You can monitor the progress of an ongoing log in several
ways:
• Click on the
log items
tab (see
) for
a list of the parameters specified for logging.
• Click on the
contents
tab (see
)
for a list of all the data points logged to date for the
parameter currently highlighted on the log items tab.
• Click on the [graph] option button to display a graphical
representation of the data logged to date.
NOTE:
The graph is displayed in its own window, which is
opened on top of the PC log window. For instructions on
using the
graph log
window, refer to the
graphing output
section
in
Chapter 2
of the
PanaView User’s manual
.
• Click on the [refresh] option button to update the
information shown on the
contents
tab and in
the
graph log
window. Any data logged since the
last use of the [refresh] option button is added to
the list and to the graph.
Remember that only two parameters per channel may
be graphed, and that the same two parameters must
be graphed for each channel of a multi-channel graph
display. When you have finished viewing the graph, click
on the [close] option button to close the
graph
window
and leave the log running.
4. To terminate the logging process, simply click on the
[stop] option button, which has replaced the original
[start] option button. (The
stop time
automatically
appears in the
PC log
window.)
Because a PC log has no specific “
stop time
,” the log
will continue to run until it is manually stopped (unless
the PC is turned off or you run out of hard drive space).
34
Summary of Contents for DigitalFlow XGF868i
Page 1: ...DigitalFlow XGF868i Panametrics flare gas flow transmitter Programming manual...
Page 2: ...ii...
Page 4: ...no content intended for this page iv...
Page 10: ...x...
Page 38: ...28...
Page 46: ...no content intended for this page 36...
Page 54: ...44...
Page 60: ...50...
Page 88: ...78...
Page 94: ...84...


