38
7.4. Bar Graph Screen
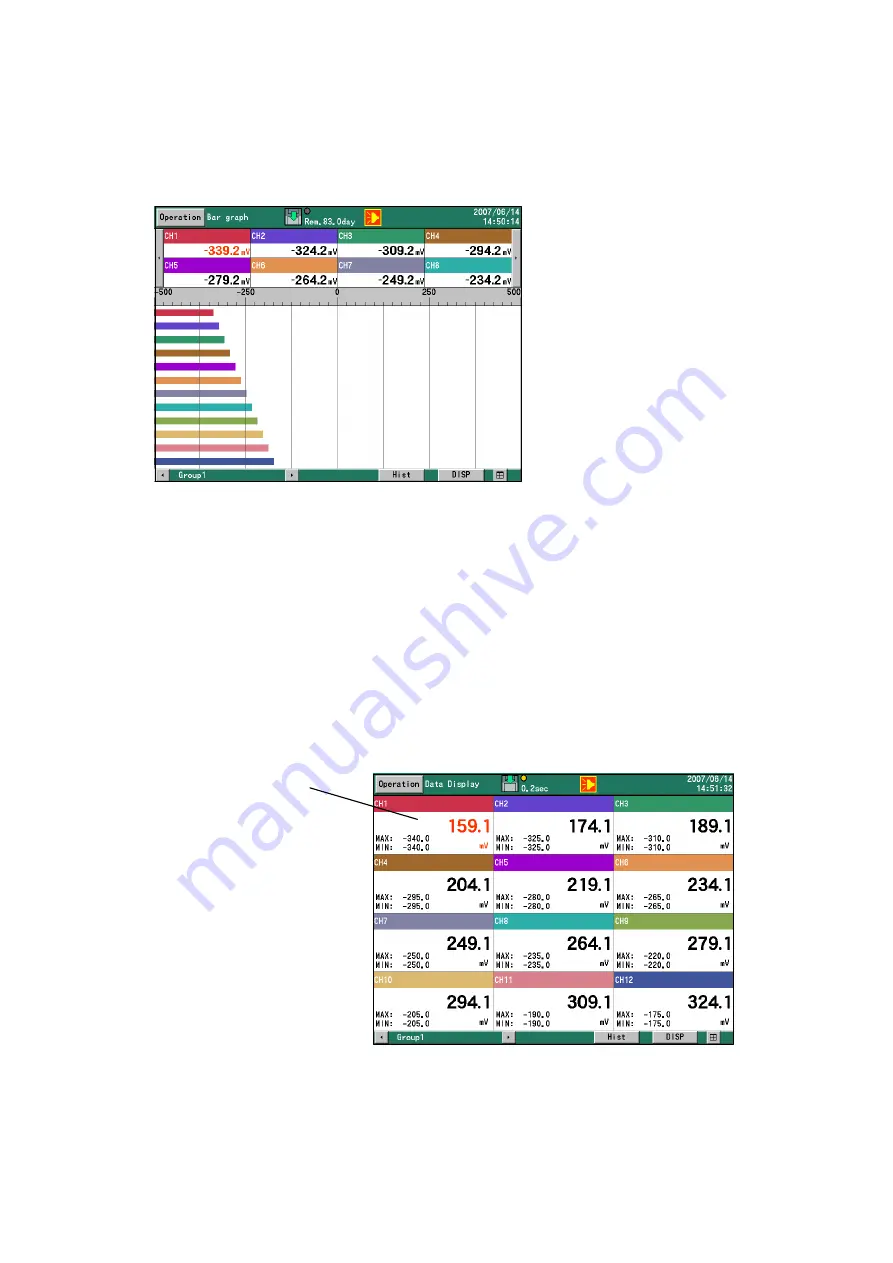
On this screen, bar graphs display the readings for each channel in real time, for easy visual
evaluation. The scales and length of the bars are determined by the display scale of the channel with
the lowest channel number in the group.
The ENTER menu
Not available
Special functions of keys (see 7.1 above for other functions)
None.
7.5. Numeric Display Screen
Data readings for each channel and alarm status are displayed. Depending on the number of
numeric data display frames and the number of registered groups, the data for 1, 2, 3, 4, 6, 8, 9, 10,
12, 24, 36, 48 or 56 channels is displayed.
The ENTER menu
Not available
Special functions of keys (see 7.1 above for other functions)
Not available
The data reading for a
channel with an active
alarm is shown in red.
Display options for this
section are: data display
(with or without a tag), and
no display.
}


