
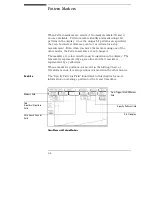
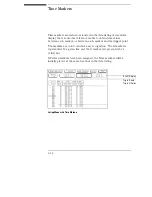


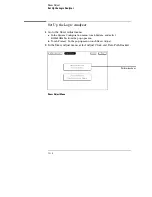


Statistics Markers
After patterns are assigned to the X and O markers, statistical
information becomes available when markers are set to Statistics. The
logic analyzer displays the following information:
•
Number of valid runs (runs where Pattern markers were able to be
placed on specified patterns).
•
Minimum time between the X and O Pattern markers.
•
Maximum time between the X and O Pattern markers.
•
Average time between the X and O Pattern markers.
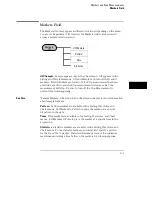
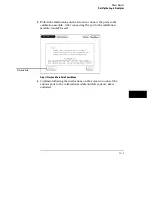
The markers are color coded for easy recognition in the data listing.
The X marker is represented by a green line and the O marker is
represented by a yellow line.
Statistics are based on the time between the X and O. Both markers
must be found before valid statistical information is displayed.
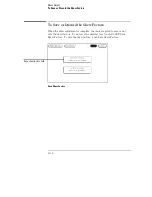
In repetitive run mode, the display is updated each time a valid run
occurs until you select Stop.
In single run mode, each time you select Run an additional valid run
will be added to the data and the statistics will be updated. This
process continues unless you change the placement of the X and O
Pattern markers between runs.
9–14
Summary of Contents for 16517A
Page 3: ...The Agilent Technologies 16517A 4 GSa S Timing and 1 GSa S State Logic Analyzer ii ...
Page 5: ...iv ...
Page 11: ...Contents 6 ...
Page 12: ...1 General Information ...
Page 18: ...2 Probing ...
Page 29: ...2 12 ...
Page 30: ...3 The Format Menu ...
Page 42: ...4 The Trigger Menu ...
Page 79: ...4 38 ...
Page 80: ...5 The Listing Menu ...
Page 86: ...6 The Waveform Menu ...
Page 106: ...7 The Compare Menu ...
Page 122: ...8 The Chart Menu ...
Page 133: ...8 12 ...
Page 134: ...9 Markers and Stop Measurements ...
Page 149: ...9 16 ...
Page 150: ...10 Skew Adjust ...
Page 156: ...11 Error Messages ...
Page 165: ...11 10 ...
Page 166: ...12 Specifications and Characteristics ...
Page 176: ...13 Installation and Service ...
Page 189: ...13 14 ...
Page 193: ...Index 4 ...


