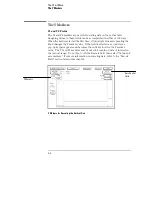
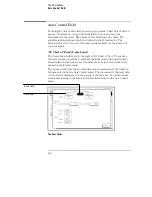


The Chart Menu
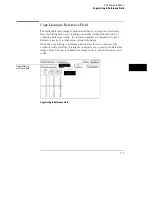
Chart is a software post-processing feature that provides the ability to
build X-Y graphs of label activity using state data.
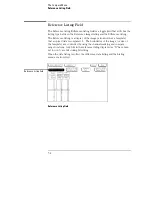
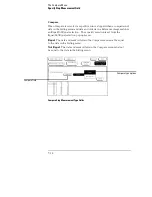
The Y axis of the Chart menu always represents data values for a
specified label. You can select whether the X axis represents states
(rows in the Listing menu) or the data values for another label.
Chart Post-Processing Features
•
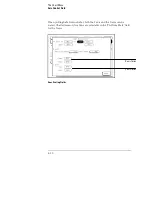
When the X axis is set to State, X and O markers are available
which can be used to search for specific data patterns, document
time intervals of interest in timing mode, and gather statistics on
the time between specific patterns in timing mode.
•
Pattern marker placement is synchronized with the Listing and
Waveform menus.
•
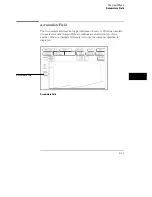
Accumulate mode allows the chart display to build up over several
runs.
•
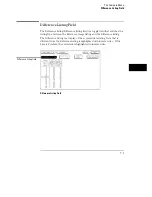
You can set a range of data to plot, scaling both the axes to
selectively view only data of interest.
•
You can generate XY plots of Label versus Label or Label versus
State.
8–2
Summary of Contents for 16517A
Page 3: ...The Agilent Technologies 16517A 4 GSa S Timing and 1 GSa S State Logic Analyzer ii ...
Page 5: ...iv ...
Page 11: ...Contents 6 ...
Page 12: ...1 General Information ...
Page 18: ...2 Probing ...
Page 29: ...2 12 ...
Page 30: ...3 The Format Menu ...
Page 42: ...4 The Trigger Menu ...
Page 79: ...4 38 ...
Page 80: ...5 The Listing Menu ...
Page 86: ...6 The Waveform Menu ...
Page 106: ...7 The Compare Menu ...
Page 122: ...8 The Chart Menu ...
Page 133: ...8 12 ...
Page 134: ...9 Markers and Stop Measurements ...
Page 149: ...9 16 ...
Page 150: ...10 Skew Adjust ...
Page 156: ...11 Error Messages ...
Page 165: ...11 10 ...
Page 166: ...12 Specifications and Characteristics ...
Page 176: ...13 Installation and Service ...
Page 189: ...13 14 ...
Page 193: ...Index 4 ...


