22
Operation
626140-9149-911
Operating manual TEMPAR console V9.0
3.2.5
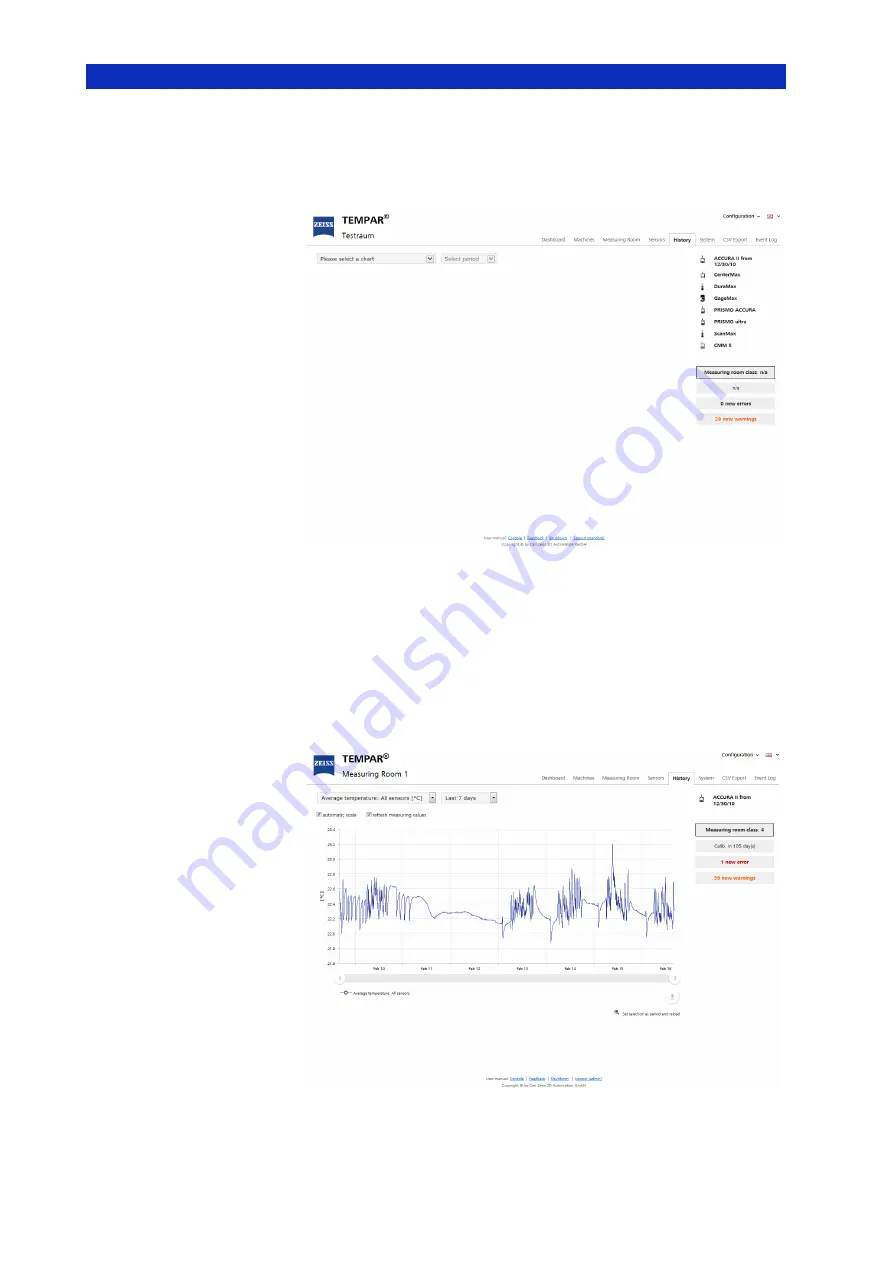
"History” menu
Fig. 17:
"History” menu
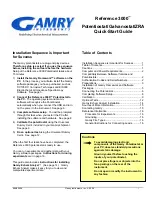
In the "History" menu, recorded measured values such as the
temperature, gradient, barometric pressure or air humidity can be
graphically displayed. For this, a value must be selected in the left
drop-down menu. To the right, a predefined or freely definable period is
selected. The two settings are used to generate a chart. Provided a
selection has already been made, the values of the last selection are
immediately displayed.
Fig. 18:
History - chart


