


59
AECG100 | User Manual
Figure 70: Using SpO
2
Table
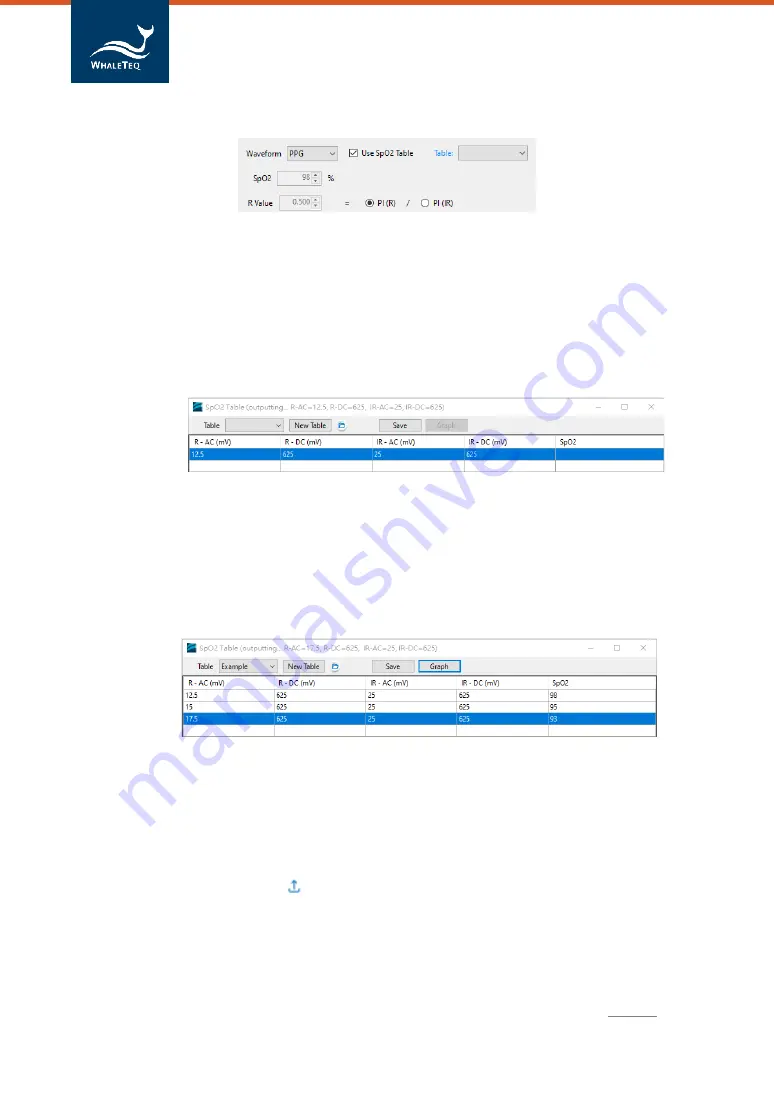
Click “New Table” button to add
a SpO
2
table, and DUT shall be
put onto AECG100 to test. As shown in the following figure 71,
users may set PPG R-AC (12.5), R-DC (625), IR-AC (25), and IR-DC
(625). AECG100 automatically output optical signal. Users shall
observe the SpO
2
value from DUT, and fill this SpO
2
value into the
table.
Figure 71: Build SpO
2
Table (1)
As shown in the following figure 72, user can change the AC values
of R or IR (one at a time) to conduct a series of tests to get SpO
2
values and fill them into the SpO
2
table. Press
“
Save
”
button to
save the table as a file.
Figure 72: Build SpO
2
Table (2)
After completing the SpO
2
table, press
“
Graph
”
button to obtain a
R-curve based on the SpO
2
table, and users may adjust the degree
of polynomial. When selecting simple equation, AECG100
software will determine the equation with intercept and slope.
Press upload at the upper-right corner to adjust the R-Curve
equation for DUT.


