AECG100 | User Manual
WHALETEQ
AECG100
User Manual
Revision 2022-06-10
AECG100 PC Software Version 1.0.6.67
Страница 1: ...AECG100 User Manual WHALETEQ AECG100 User Manual Revision 2022 06 10 AECG100 PC Software Version 1 0 6 67 ...
Страница 2: ...d the programs as is without warranty of any kind either expressed or implied including but not limited to the implied warranties of merchantability or fitness for a particular purpose This document could contain technical inaccuracies or typographical errors Changes are periodically made to the information herein these changes will be incorporated in future revisions of this document WhaleTeq Co ...
Страница 3: ...2 5 2 Standalone Operation 22 2 6 Reflective PPG Module Fixture Mounting Base Dimensions 22 Software Installation 23 3 1 System Requirements 23 3 2 USB Driver Installation 24 3 3 Microsoft Net Framework 4 0 Installation 25 Software Interface 26 4 1 General 26 4 2 ECG Mode 28 4 3 PPG Mode 33 4 4 PWTT Mode 42 4 5 Auto Test SpO2 Mode 48 4 6 SpO2 Mode 55 4 7 Auto Sequence Mode 64 4 8 Supported Raw Dat...
Страница 4: ...t Mode 76 9 3 PWTT Test Mode 77 9 4 Reflective PPG Module SpO2 Test Mode 77 9 5 Transmission PPG Module SpO2 Test Mode 78 9 6 General Specification 80 Ordering Information 81 Package Contents 83 Revision History 86 Contact WhaleTeq 87 ...
Страница 5: ...eral Specification 80 Table 10 PPG Module General Specification 80 Table 11 AECG100 Test System Ordering Information 81 Table 12 AECG100 Main Console Unit Ordering Information 81 Table 13 PPG Module Ordering Information 82 Table 14 Optional Software Add on Pack Ordering Information 82 Table 15 AECG100 1R 525 Package Contents 83 Table 16 AECG100 2R 940 Package Contents 84 Table 17 AECG100 2R 880 Pa...
Страница 6: ...ction 20 Figure 16 Fixture Mounting Base of PPG 1R Module 22 Figure 17 Fixture Mounting Base of PPG 2R modules 22 Figure 18 Sectional View 23 Figure 19 Button Functions in General Mode 26 Figure 20 PPG Config 26 Figure 21 Trigger level and Ambient light 27 Figure 22 Settings Function List 28 Figure 23 ECG Mode Interface Buttons 28 Figure 24 Pacemaker Simulation Setting 29 Figure 25 ECG Respiration...
Страница 7: ...es of R and IR appears 50 Figure 58 The DC value of R and AC and DC values of IR are automatically filled in 51 Figure 59 Fill in the AC value of R and the SpO2 value and save 51 Figure 60 The DUT s R curve 52 Figure 61 Signal Tab 52 Figure 62 Sampling PD 53 Figure 63 Sampling LED Switch 53 Figure 64 SpO2 mode UI for reflective SpO2 module and transmission SpO2 module 55 Figure 65 Setting R Curve ...
Страница 8: ...e Mode 65 Figure 82 Add Waveform Files 65 Figure 83 AECG100 Interface Setup 70 Figure 84 Self Calibration Setup 71 Figure 85 AECG100 300 mV DC offset 71 Figure 86 DC Voltage Verification 300mV 72 Figure 87 Self Calibration Setup 72 Figure 88 DC Voltage Verification 300mV 73 ...
Страница 9: ... module of their choice The single channel PPG module provides a green LED offering simulated PPG heart rate signals besides the dual channel PPG module provides red LED and infrared LED simulating different Sp02 blood oxygen levels When the ECG module and the PPG module work at the same time the users can get the pulse wave transit time PWTT by adjusting the time difference PTTp or PTTf between t...
Страница 10: ... base is provided for the user to develop the fixture to fasten DUT onto PPG modules of AECG100 3 LA L Electrode Connect to DUT s matching electrode to output ECG signal 4 RA R Electrode Connect to DUT s matching electrode to output ECG signal 5 RL2 N2 Electrode Connect to DUT s matching electrode 6 RL1 N1 Electrode Connect to DUT s matching electrode 7 AUX PWR Port Connect to a computer s USB por...
Страница 11: ... is 1 time per second Green LED flashing AECG100 is in PC software operation mode The flash frequency is 1 time per second 11 GND Terminal In ECG test mode we suggest putting a metal plate under AECG100 and DUT Then connect the AECG100 GND terminal and DUT ground to the metal plate to lower the noise Please see section 2 3 for the set up illustration 12 Monitor Port The ECG output monitor port to ...
Страница 12: ...Mode A B C The default parameters are for PWTT tests Note When testing AECG100 main console with different PPG modules re saving Mode A B C is required in order to obtain desired test results 14 Mode Selection Button To select amongst Mode A B C 15 DB15 Port Female The port on the AECG100 main console to be connected with various PPG modules 16 DB15 Port Male The port on the PPG module to be conne...
Страница 13: ...mes of original voltage 21 PD1 Monitor Port This is for the PPG 2R 880 or the PPG 2R 940 PPG module to connect to the oscilloscope to measure electrical signal transferred by AECG100 PD This port is for monitoring the optical signal of DUT s red LED 22 LED2 Monitor Port This is for the PPG 2R 880 or the PPG 2R 940 PPG module to connect to the oscilloscope and measure the output voltage of the infr...
Страница 14: ... an oscilloscope to measure the optical signal sent by the red LED of the DUT to the PD 4 LED Monitor Port With MCX to BNC port PPG 2TF 660 can be connected to an oscilloscope to measure the voltage of the AC analog signal driving the red LED and the switch status of DUT R IR LED This voltage is 100 times higher than the original driving voltage 5 Standard Accessory MCX RF male to BNC cable 2 K29 ...
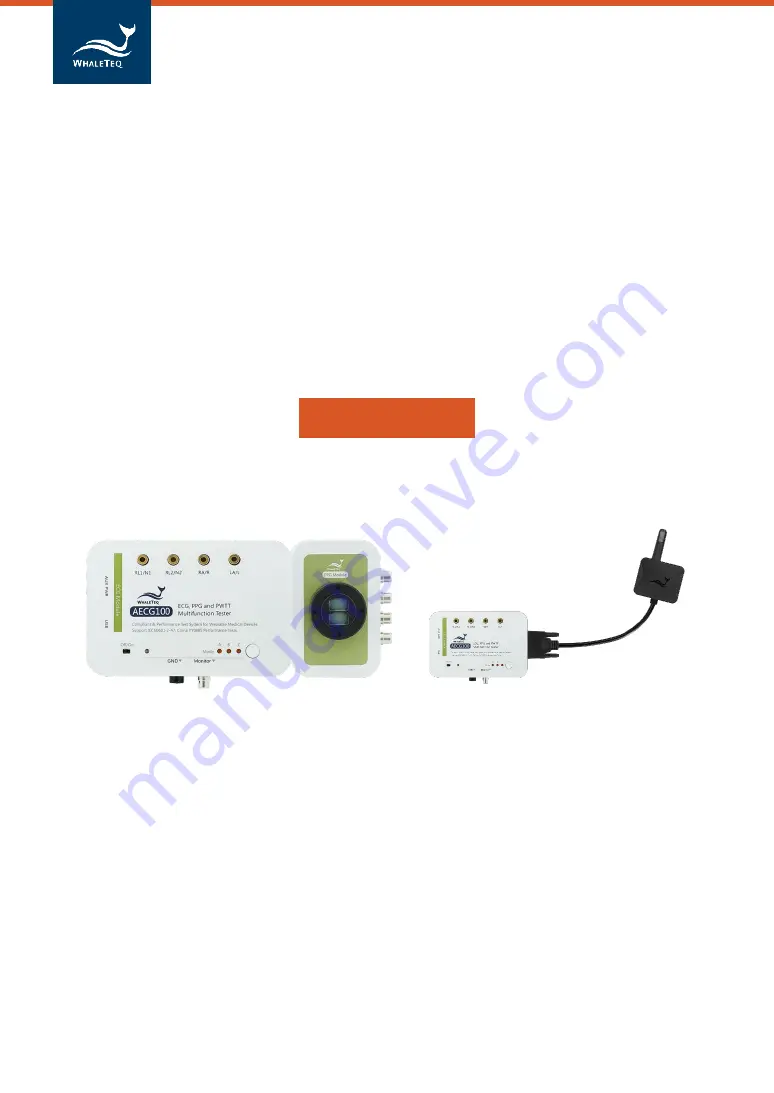
Страница 15: ...in Console and PPG Module Connection Directly connect with PPG module Figure 4 Direct Connection between AECG100 and PPG Module Connect with PPG module with DB15 Figure 5 Connection through DB15 Figure 6 Direct Connection between AECG100 and PPG 2TF 660 ...
Страница 16: ...orced to connect with the reflective module ECG Test Mode with Noise Reduction Suggestion see 2 1 11 GND Figure 8 ECG Test Mode with Noise Reduction Product Wiring Diagram PPG Heart Rate Test Mode Figure 9 PPG Heart Rate Test Mode Product Wiring Diagram Frame ground or EP terminal Metal bench metal sheet or foil ECG Device Under test ...
Страница 17: ... Transit Time Test Mode Figure 10 Pulse Wave Transit Time Test Mode Product Wiring Diagram SpO2 Test Mode Figure 11 SpO2 Test Mode Product Wiring Diagram Auto Sequence Test Mode Figure 12 Auto Sequence Test Mode Product Wiring Diagram ...
Страница 18: ...tware on the computer and see if the pulse signals are visible on the PD s sampling tab If so the LED of the DUT is lined up with AECG100 s PD Step 3 Confirm the positions of the DUT s PD and AECG100 s LED Execute the AECG100 software and under PPG test mode set DC 500mV AC 30mV BPM 60 and check if DUT can get the heart rate of 60 BPM If so then the relative positions of DUT s PD and AECG100 s LED...
Страница 19: ...R port and USB port on the AECG100 main console at the other end of the USB cables plug the USB Type A connectors into a laptop or a PC Switch the power switch located at the lower left corner on the top of the AECG100 main console to On to power on it Note Align the LED and PD on DUT to the PD and LED on the PPG 2TF 660 respectively Step 2 Go to the official AECG100 webpage to download and instal...
Страница 20: ...ftware should be installed properly AECG100 offers a total of 4 test modes including ECG test mode PPG test mode PWTT test mode and SpO2 test mode Auto Sequence test mode can combine any of the 4 Please see chapter 4 Software Interface for a detailed operation description ECG test mode AECG100 can conduct single lead ECG testing under this test mode All the ECG related standards are supported incl...
Страница 21: ...iosclerosis Auto Test SpO2 Mode Apply only to PPG 2TF 660 module When PPG 2TF 660 detects the signals from the DUT the system will identify the parameter settings such as Trigger Level and DC value of R IR and record Trigger Level to SpO2 and PPG tabs Users can adjust the pulse amplitude transmission rate ambient light value and quick verification SpO2 Mode Under this test mode users can individua...
Страница 22: ...ture Mounting Base Dimensions Below are the dimensions of PPG module fixture mounting base User can develop a fixture to fasten DUT onto the PPG module fixture mounting base AECG100 3D Model can be downloaded HERE Mechanical Drawing Fixture mounting base of PPG 1R Module Figure 16 Fixture Mounting Base of PPG 1R Module Mechanical Drawing Fixture mounting base of PPG 2R modules Figure 17 Fixture Mo...
Страница 23: ...Microsoft Net Framework 1 5 GHz CPU or higher 1GB RAM or higher1 USB port 1 Relative to normal PC processing there is no special use of PC speed However there has been noted a slow increase in system RAM usage over long periods of time up to 30 40MB related to MS Windows garbage collection PCs with only 512MB or less installed and are running several other programs in particular Internet Explorer ...
Страница 24: ...Microsoft Windows 8 and Windows 8 1 If Windows 8 and Windows 8 1 can t recognize AECG unit please download mchpcdc inf from WhaleTeq website This driver is provided by Microchip to be used with PIC microprocessors having built in USB function As mchpcdc inf provided by Microchip does not contain digital signature please disable driver signature enforcement in Windows 8 and Windows 8 1 Please click...
Страница 25: ...tions to finish the installation There may be a warning that the driver is not recognized by Windows and this can be ignored Please click here to watch the tutorial video 3 3 Microsoft Net Framework 4 0 Installation WhaleTeq software is developed based on Microsoft Net Framework 4 0 If AECG software fails to execute properly please check whether Microsoft Net Framework 4 0 or higher versions was i...
Страница 26: ...he inverted waveform which can be confirmed on an oscilloscope Check Synchronized Pulse to enable the synchronization behavior between AECG100 LED and DUT LED Figure 20 PPG Config Trigger level Set the trigger level that drives the AECG100 LED to turn on after the AECG100 PD detects the value of the LED brightness of the DUT Ambient light Available when connecting the transmission SpO2 module PPG ...
Страница 27: ... to switch among English simplified Chinese and traditional Chinese Select Restore Factory Settings to reset the following back to default settings LED Level of PWTT SpO2 and PPG tabs and Trigger level from Sampling of SpO2 and PPG tabs Select Device Information to check the device serial number Select License to confirm AECG100 device ID and check the activation status of ECG standard assistant s...
Страница 28: ... 4 2 ECG Mode ECG Mode can be separated into 2 sections The upper section is for waveform selection and test parameter setting the lower section is for waveform playback display and setting Upper section Figure 23 ECG Mode Interface Buttons 8 1 2 3 4 5 6 7 9 10 11 12 13 ...
Страница 29: ... Impedance Test To add 620kΩ 4 7nF to the output signal This is for ECG DUT to measure the amplitude and evaluate the input impedance of ECG DUT 8 Pacemaker Output simulated ECG pacemaker signal to ECG DUT Figure 24 Pacemaker Simulation Setting 9 RLD Right Leg Detection for measurement of reference voltage difference of DUT 10 Respiration AECG100 uses the impedance pneumography method to simulate ...
Страница 30: ...stop frequency and duration This function is for testing the frequency response of ECG DUT by using the sine wave Figure 26 ECG Frequency Scan Setting 12 Std Assistant software Standard assistant software supports international medical standards of IEC 60601 2 47 and YY 0885 It simplifies the standards into test parameters test criteria and test sequences This is an optional function please contac...
Страница 31: ...ation and interval Figure 27 ECG Auto Heart Rate Testing Setting Lower section The UI is illustration only For detailed display please check on oscilloscope 1 Signal tab Users can reset save recall play waveform with preset parameters Figure 28 Signal tab 2 Player tab Users can load play loop raw data file Figure 29 Player Tab 8 4 5 3 1 6 7 2 8 10 11 9 1 12 7 2 ...
Страница 32: ...ecall Load the previously saved test parameters stored in Standalone device Mode A B C or as a PC file ecg format 6 Play Stop Play the selected waveform with preset parameters Once stopped play from the beginning 7 Waveform Display Scale Adjust the display scale for 5mm mV 10mm mV or 20mm mV 8 Display Window Enlargement Click to enlarge the display window 9 Load User can load and play raw data via...
Страница 33: ...layed raw data 4 3 PPG Mode It requires to connect PPG 1R 525 PPG 2R 880 PPG 2R 940 or PPG 2TF 660 module to initiate PPG test mode PPG Mode can be separated into 2 sections The upper section is for waveform selection and test parameter setting the lower section is for waveform playback display and setting Upper section The software UI is for AECG100 main console unit with PPG 1R 525 module Figure...
Страница 34: ...ig Refer to 4 1 General 1 PPG Config 6 Setting Refer to 4 1 General 2 Setting 7 AC Offset Shift the signal upwards by the value of AC offset 8 Respiration Add respiration modulation to the PPG function Baseline Modulation BM Pulse Amplitude Modulation AM and Frequency Modulation FM are the available signals for breath modulation i Baseline Modulation BM Change in intrathoracic pressure when breath...
Страница 35: ...gnal with different parameters respiration rate inhale exhale ratio and variation range to conduct the signal simulation Respiration Rate is the number of breaths taken during 60 seconds intervals ranging from 1 to 150 BrPM Respiration Ratio is the ratio of inhalation to exhalation up to 1 5 Variation adjustment ranges 16 16 BM refers to the baseline drift of the PPG amplitude during one breathing...
Страница 36: ...the original amplitude during one breathing cycle FM shifts the pulse duration instead of amplitude in one breathing cycle the interval change between the heartbeat is 16 16 of the original set heartbeat The adjustment method is shown in the figures below Figure 35 PPG Respiration Setting ...
Страница 37: ...forms recorded in clinical trials to use in PWTT test mode The recorded disease waveforms including AF Atrial Fibrillation APC Atrial Premature Complexes VPC Ventricular Premature Contraction and first degree AV block The first record is available for trial purpose and illustrated in Player tab from the lower section Please contact WhaleTeq to purchase the completed database playback function Figu...
Страница 38: ...r AECG100 main console unit with PPG 1R 525 module The UI is illustration only For detailed display please check on oscilloscope Signal Tab Figure 38 Signal Tab Sampling Tab Sampling PD Figure 39 Sampling PD Sampling Tab Sampling LED Switch Figure 40 Sampling LED Switch 9 5 6 4 1 7 8 2 3 16 11 12 10 1 13 14 15 2 3 16 11 12 10 1 13 14 15 2 3 ...
Страница 39: ...ective SpO2 module PPG 2R 880 PPG 2R 940 transmission SpO2 module PPG 2TF 660 The UI is illustration only For detailed display please check on oscilloscope Signal Tab Figure 42 Signal Tab Sampling Tab Sampling PD Figure 43 Sampling Tab Sampling PD 9 5 6 4 1 7 21 8 2 3 15 11 12 10 1 13 14 2 3 9 18 19 17 1 20 21 2 3 ...
Страница 40: ...g tab for PD LED Switch Users can observe DUT LED brightness and AECG100 LED switch status 3 Player tab Users can load play loop raw data file 4 Reset Resume the default setting in the upper section 5 Save Save the preset test parameters from the upper section into Standalone device Mode A B C PC file in ppg or Waveform Raw in txt format Figure 46 Save Test Parameters 9 17 18 16 1 19 21 20 2 3 15 ...
Страница 41: ...ted On AECG100 outputs PPG waveform upside down Inverted Off AECG100 output PPG waveform as per the window display Sync Pulse On LED behaviors of AECG100 synchronize with DUT LED Sync Pulse Off AECG100 LED remains on 10 Sampling To sample and measure the DUT LED brightness 11 Signal PD Green PD RED PD Infrared It shows the intensity and behaviors of DUT LED sampled by AECG100 s PD Displayed in Blu...
Страница 42: ...nnel types The Total Length displays the total playback time Users have to manually adjust Output Setting to ensure the AECG100 output signal properly Figure 47 Waveform Player 17 Play Stop Play the selected raw data file in txt format Once stopped play from the beginning 18 Loop Check to replay the raw data file repeatedly 19 Current Position Display the timing of the played raw data 20 Waveform ...
Страница 43: ...back display and setting Upper section The software UI is for AECG100 main console unit with PPG 1R 525 module Figure 48 PWTT Mode UI for PPG 1R 525 module The PWTT mode UI is for AECG100 main console unit with reflective SpO2 module PPG 2R 880 PPG 2R 940 transmission SpO2 module PPG 2TF 660 Figure 49 PWTT mode UI for reflective SpO2 module and transmission SpO2 module 5 6 2 3 4 9 1 7 8 10 11 5 6 ...
Страница 44: ...to peak and PTTf is the time to trough 9 Database Player In PWTT test mode AECG100 can download and play PhysioNet MIMIC database mimicdb Furthermore the WhaleTeq database includes 30 records of PPG waveforms recorded in clinical trials to use in PPG test mode and 10 records of PPG and ECG waveforms recorded in clinical trials to use in PWTT test mode The recorded PPG disease waveforms include AF ...
Страница 45: ...ed display please check on oscilloscope Figure 50 PWTT mode UI for PPG 1R 525 module The PWTT mode UI is for AECG100 main console unit with reflective SpO2 module PPG 2R 880 PPG 2R 940 transmission SpO2 module PPG 2TF 660 The UI is illustration only For detailed display please check on oscilloscope 4 5 3 1 6 7 8 2 4 5 3 1 6 7 8 2 10 11 9 1 12 8 2 ...
Страница 46: ...v or Waveform Raw in txt format Figure 52 Save Setting Note Standalone device Mode A B C and PC file can be used in 1 Signal tab Recall and Auto Sequence Mode Only Waveform Raw can be played in 2 Player tab 5 Recall Load the previously saved test parameters stored in Standalone device Mode A B C or as a PC file pwv format 6 Play Stop Play the selected waveform with preset parameters Once stopped p...
Страница 47: ...raw data file can be loaded by clicking the File section The Signal number corresponds to channel types The Total Length displays the total playback time Users have to manually adjust Output Setting to ensure AECG100 outputs signal properly Figure 53 Waveform Player Setting 10 Play Stop Play the selected raw data file in txt format Once stopped play from the beginning 11 Loop Check to replay the r...
Страница 48: ...If the Auto Trigger Level reminder shows please check the IR status or whether the DUT connects to the PPG 2TF 660 and is in a proper measuring position After confirming the aforementioned situations click OK to continue Figure 54 Auto Trigger Level reminder Auto Test SpO2 Mode tab can be separated into 2 sections The upper section is for waveform selection and test parameter setting the lower sec...
Страница 49: ... set up a proper measuring position for test 5 Table The dropdown list provides 2 reference tables Masimo and Nellcor for users to compare Click the Table to create the DUT s SpO2 table for verification Please refer to the instructions below Note The Masimo and Nellcor s R curve samples are not provided by their respective owners The data are collected through the AECG100 main console measurement ...
Страница 50: ...50 AECG100 User Manual Figure 56 Auto Test SpO2 mode is operating Click Stop to show the DUT s DC values of R and IR as the figure 57 Figure 57 The DUT s DC values of R and IR appears ...
Страница 51: ... and DC values of IR are automatically filled in as the figure 58 Figure 58 The DC value of R and AC and DC values of IR are automatically filled in Fill in a designated AC value of R then the DUT shows the SpO2 value Fill in the SpO2 value in the table and click Save as the figure 59 Figure 59 Fill in the AC value of R and the SpO2 value and save ...
Страница 52: ...teps to gather enough information then click Graph to bring up the DUT s R curve Figure 60 The DUT s R curve Lower Section The UI is illustration only For detailed display please check on oscilloscope Signal Tab Figure 61 Signal Tab 5 3 4 1 2 ...
Страница 53: ...ith preset parameters 2 Sampling tab for PD LED Switch Users can observe the DUT LED brightness and AECG100 LED switch status 3 Play Stop Play the selected waveform with preset parameters Once stopped play from the beginning 4 Waveform Display Scale Adjust the display scale for 2 sec 5 sec or 10 sec 5 Inverted Sync Pulse Ambient Light 11 7 8 6 1 9 10 2 11 7 8 6 1 9 10 2 ...
Страница 54: ...Sampling Use PD of AECG100 to measure intensities of DUT LED 7 Signal PD RED PD Infrared It shows the intensity and behaviors of DUT LED sampled by AECG100 s PD Displayed in Blue and Purple curves Switch RED Switch Infrared It shows the timing AECG100 switches LED on or off Waveform displays low means AECG100 turn on LED Waveform displays high means AECG100 turns off LED Displayed in Blue and Red ...
Страница 55: ...lue is from 10 BPM to 300 BPM 2 R Value The R Value is the ratio of RED LED PI percentage and Infrared LED PI percentage Selecting PI R means changing the SpO2 value by altering the PI of the red LED selecting PI IR means changing the SpO2 value by altering the PI of the infrared LED 3 R curve the SpO2 Level Equation Adjustment Default equation is the Webster linear empirical calibration formula S...
Страница 56: ...lope of the R Curve equation by using the SpO2 Table Please refer to the description of 12 Table Figure 65 Setting R Curve 4 Output Waveform Selection Select to output different waveform types ex Sine Triangle or PPG 5 Use SpO2 Table Option 1 User can click Table to build SpO2 table with specified parameters of R IR LED Figure 66 Using SpO2 Table After completing the SpO2 table click Graph to obta...
Страница 57: ...l can only be set in accordance with the SpO2 values stored in 12 Table AECG100 automatically outputs optical signals Option 2 Select already created table from the drop down menu the function Use Calibration Curve appears Figure 68 Use Calibration Curve Function When checking Use Calibration Curve and select Degree of Polynomial a R Curve equation is generated based on the data points entered in ...
Страница 58: ...t the DC value received by DUT users can fine tune the Output DC to minimize the influence The default value is 0 9 AC value To simulate the artery volume change of artery diastolic phase and systolic phases 10 DC value To simulate reflected optical signal of the average artery and vein volume change from skin tissue bone and muscle 11 Parameter Lock and Adjustment Lock AC value to adjust PI and D...
Страница 59: ...O2 Table 1 As shown in the following figure 72 user can change the AC values of R or IR one at a time to conduct a series of tests to get SpO2 values and fill them into the SpO2 table Press Save button to save the table as a file Figure 72 Build SpO2 Table 2 After completing the SpO2 table press Graph button to obtain a R curve based on the SpO2 table and users may adjust the degree of polynomial ...
Страница 60: ... of the Intercept and Slope of the SpO2 Lower Section The UI is illustration only For detailed display please check on oscilloscope Signal Tab Figure 74 Signal Tab Sampling Tab Sampling PD Figure 75 Sampling PD 9 5 6 4 1 7 21 8 2 3 15 11 12 10 1 13 14 2 3 ...
Страница 61: ... Sampling tab for PD LED Switch Users can observe the DUT LED brightness and AECG100 LED switch status 3 Player tab Users can load play loop raw data file 4 Reset Resume the default setting in the upper section 5 Save Save the preset test parameters from the upper section into Standalone device Mode A B C PC file in spo or Waveform Raw in txt format 9 17 18 16 1 19 20 2 3 15 11 12 10 1 13 14 2 3 ...
Страница 62: ... send the AECG ID to WhaleTeq to purchase and obtain the Activation Key to access the software Figure 79 Enter Activation Key Screen Display 6 Recall Load the previously saved test parameters stored in Standalone device Mode A B C or as a PC file spo format 7 Play Stop Play the selected waveform with preset parameters Once stopped play from the beginning 8 Waveform Display Scale Adjust the display...
Страница 63: ...ys high means AECG100 turns off LED Displayed in Blue and Red curves PD Switch selection is memorized 12 Freeze After enabling this function the display of PD LED switch sampling would stay as it is 13 Max Peak Display the peak value of DUT LED sampled by AECG100 PD 14 Time Axis Adjust the time axis of PD sampling and switch 15 Enlarge Click to better view the sampling details 16 Load To load PPG ...
Страница 64: ...he played raw data 20 Display Scale Adjust the display scale for 2 sec 5 sec or 10 sec time frames of AECG100 PD sampling windows 21 Output waveform selection Select to play R and IR signals together or separately 4 7 Auto Sequence Mode Auto Sequence mode allows users to use the saved waveform file from ECG PWTT SpO2 PPG tabs to edit the sequence and testing time as an auto test file This auto tes...
Страница 65: ... testing sequence in seq format 3 Recall To load the saved auto sequence 4 Reset To remove all the loaded waveform files 5 Testing Combination Test combinations displayed in an assigned sequence 6 Sequence Cursor Drag the file to change the order of the sequence played 7 Waveform Parameter Display To display the test parameters of selected test sequences Unable to modify the test parameters 8 Play...
Страница 66: ...l description signal 2 sample data 1 signal 1 sample data 1 signal 2 sample data 2 signal 1 sample data 2 signal 2 sample data N signal 1 sample data N signal 2 Description sample frequency Input the frequency of sample data number of samples per signal The limitation is related to the available memory size of PC system If PC system has available memory for 1Gb the maximum number of single channel...
Страница 67: ...e to a specific AC value by the following formula Data Value Maximum Data Value Minimum Data Value Maximum AC Level For example if we setup AC level 10mV while the maximum data value is 12 500 and the minimum data value is 0 000 the sample data 0 021 will become 0 021 12 500 0 000 10 0 0168 mV Example 1000 1000 2 sine wave 5 sine wave 10 0 000 0 000 0 031 0 063 0 063 0 126 0 094 0 188 0 126 0 251 ...
Страница 68: ... 688 1 029 2 059 0 999 1 997 0 968 1 935 0 937 1 874 0 906 1 812 0 875 1 750 0 844 1 688 0 813 1 626 0 782 1 564 0 751 1 502 0 720 1 440 0 689 1 378 0 658 1 316 0 627 1 253 0 595 1 191 0 564 1 129 0 533 1 066 0 502 1 004 0 471 0 941 0 439 0 879 0 408 0 816 0 377 0 753 0 345 0 691 0 314 0 628 0 283 0 565 0 251 0 502 0 220 0 440 0 188 0 377 ...
Страница 69: ...and can calibrate the offset value of the device within the original specification of WhaleTeq Under normal use the device is recommended to be calibrated once a year There are three kinds of calibration validation methods for AECG100 calibrated by Masimo Radical 7 Pulse CO Oximeter calibrated by Covidien Nellcor Portable SpO2 Patient Monitoring System or measuring electrical and LED PD parameters...
Страница 70: ... 0 1 Hz and output to the RA lead electrode as the figure shown below Figure 83 AECG100 Interface Setup 2 Connect the multimeter to RA and LA of the AECG100 and measure the DC mV The value should be in 1 of 5 mV because the output amplitude of the AECG100 gives alternating 5s 0 1 Hz square wave phases at 2 5mV and 2 5mV which the multimeter is zeroed delta function at one phase e g 2 5mV with read...
Страница 71: ...ck is shown as the red square in the figure below The AECG100 connects DC in series with electrode wire in the case RA Figure 85 AECG100 300 mV DC offset 4 The user can verify the DC voltage by setting up the parameters of the AECG100 AP to Square 0 mV 0 1 Hz and DC Offset Setting to 300 mV ...
Страница 72: ...e The value should be in 1 of 300 mV The setup is shown in the below figure Figure 87 Self Calibration Setup 6 If the user wants to check the DC voltage other than 300 mV set the DC voltage from 1000 mV to 1000 mV with 5 accuracy Please look at the figure below for details Note This extra DC voltage can support some other than 300 mV testing ...
Страница 73: ...wer indicator is off Step2 Re connect the PPG module to the AECG100 main console Step3 Turn on the power switch on AECG100 main console unit and assure the power indicator is on 2 When Red LED of the power indicator remains on If Red LED remains on the AECG100 system is crashed Please try turning off and then turning on the AECG100 test system 3 No LED display at the power indicator For no LED dis...
Страница 74: ...Test System for at least 30 minutes before testing 4 Before using PPG related functions please assure the distance between the PPG module head and DUT PPG sensor is fixed 5 During testing it is essential to minimize the ambient light as it would influence the test result as well 6 LED luminous decay occurs as time goes on It is recommended to send the AECG100 units to WhaleTeq for calibration ever...
Страница 75: ...on Timing Accuracy 1ms Pacing pulse amplitude Range 1000mV 1000mV Accuracy 2mV pulse 1 2mV or 2mV pulse 10 Pacing pulse width Range 0 1ms 2ms Resolution 0 1ms Accuracy 5μs Pacing pulse characteristics Rise fall time 5μs Overshoot 1 Settling time 1 Sample rate Rate 50 40K Normal Standalone 10K Raw data mode Accuracy Depend on system clock accuracy DC offset fixed noise free sourced from internal su...
Страница 76: ... BPM Range 10 300 BPM Resolution 1 BPM Accuracy 1 BPM LED AC Level reference output RCA Range 0 075 3 V Full range Resolution 1 3000 full range Accuracy 1 Lumen Range 50 925 Lux full range 5mm from diffusion film Resolution 1 3000 full range Accuracy 6 Light wavelength Range 525nm Accuracy 10nm S N Ratio 51dB with USB isolator PD response time Rising 1μs Typical Falling 1μs Typical The data is for...
Страница 77: ...ecification BPM Range 10 300 BPM Resolution 1 BPM Accuracy 1 BPM LED AC Level reference output RCA Range 0 075 3V Full range Resolution 1 3000 full range Accuracy 1 PI AC level DC level Range 0 025 30 AC DC varies with AC or DC level Accuracy NA Light wavelength Range Red 660nm Infrared 940nm 880nm Accuracy Red 10nm Infrared 10nm RED light Absolute Irradiance 100 Intensity 3 55 mW m 2 nm Accuracy ...
Страница 78: ...ng the spectrometer with 2 integrating sphere and fastening DUT with the integrating sphere to measure the absolute irradiance value of DUT LED The PD response time will vary with the light intensity of the DUT 9 5 Transmission PPG Module SpO2 Test Mode Table 8 Transmission PPG Module SpO2 Test Mode Specification Parameter Specification BPM Range 10 300 BPM Resolution 1 BPM Accuracy 1 BPM LED DC L...
Страница 79: ...100 Resolution 1 Accuracy 91 to 100 1 specified accuracy of the DUT 81 to 90 2 specified accuracy of the DUT 71 to 80 3 specified accuracy of the DUT Below 70 with unspecified accuracy MCX LED voltage Amplitude AC Level x 100 Accuracy 5 The data is collected by connecting the spectrometer with 2 integrating sphere and fastening DUT with the integrating sphere to measure the absolute irradiance val...
Страница 80: ...operties Housing Plastic Weight 241g Dimensions L x W x H 150mm x 98mm x 33mm Reflective Transmission PPG Module Table 10 PPG Module General Specification Environment Operating Temp 10 40 Storage Temp 0 50 Humidity 0 80 RH Non condensing Physical Properties Housing Plastic Weight Reflective Module 165g Transmission Module 122g Dimensions L x W x H Reflective Module 70mm x 98mm x 60mm Transmission ...
Страница 81: ...module Support ECG PWTT SpO2 PPG Auto Sequence test modes AECG100 2R 880 The test system includes AECG100 main console unit with ECG module and PPG 2R 880 module Support ECG PWTT SpO2 PPG Auto Sequence test modes AECG100 2TF 660 The test system includes AECG100 main console unit and PPG 2TF 660 module Support ECG PWTT Auto Test SpO2 SpO2 PPG Auto Sequence test modes AECG100 Main Console Unit Table...
Страница 82: ...PG module Support PWTT PPG Auto Test SpO2 SpO2 Auto Sequence Test Modes Note Connect the AECG100 main console with the reflective and transmission PPG modules PPG 2R 940 PPG 2R 880 and PPG 2TF 660 can conduct SpO2 testing as the reflective and transmission SpO2 testing device Optional Software Add on Pack Table 14 Optional Software Add on Pack Ordering Information Model No Description AECG Assista...
Страница 83: ...ode The 25 recorded disease waveforms include symptoms such as AF Atrial Fibrillation APC Atrial Premature Complexes VPC Ventricular Premature Contraction and first degree AV block SAVERAW AECG Save Waveform Raw Data Standard waveforms in ECG PPG SpO2 and PWTT test modes can be saved in raw data formats for further modification Package Contents AECG100 Test Systems Table 15 AECG100 1R 525 Package ...
Страница 84: ...le 1 Table 17 AECG100 2R 880 Package Contents AECG100 2R 880 Item Q ty AECG100 Main Console Unit 1 PPG 2R 880 Module 1 USB Cable Type A Plug to Type B Plug 2 Grounding Cable 1 RCA to BNC Cable 2 Compound Terminal 4 DB15 Cable 1 Table 18 AECG100 2TF 660 Package Contents AECG100 2TF 660 Item Q ty AECG100 Main Console Unit 1 PPG 2TF 660 Module 1 USB Cable Type A Plug to Type B Plug 2 Grounding Cable ...
Страница 85: ...g to Type B Plug 2 Grounding Cable 1 RCA to BNC Cable 1 Compound Terminal 4 Table 20 PPG 1R 525 Package Contents PPG 1R 525 Item Q ty PPG 1R 525 Module 1 RCA to BNC Cable 1 Table 21 PPG 2R 940 Package Contents PPG 2R 940 Item Q ty PPG 2R 940 Module 1 RCA to BNC Cable 1 Table 22 PPG 2R 880 Package Contents PPG 2R 880 Item Q ty PPG 2R 880 Module 1 RCA to BNC Cable 1 ...
Страница 86: ... Added details to Output DC of SpO2 mode Added Absolute Irradiance for PPG R IR under Spec Chapter Specified file types saved for Waveform Raw PC file and loaded for Recall Player Auto Sequence Added ECG ground illustration Moved description of Setting PPG config to a general section SpO2 PPG parts Demo figures of Sampling tab to include PD and LED switch separately 2020 09 08 Added PPG Respiratio...
Страница 87: ...dated 2 4 DUT Best Position Adjustment Updated 2 5 Operation Modes Added 4 5 Auto Test SpO2 Mode Updated 6 1 Self calibration Added 9 5 Transmission PPG Module SpO2 Test Mode Updated Chapter 10 Ordering Information Updated Chapter 11 Package Contents Contact WhaleTeq WHALETEQ Co LTD service whaleteq com O 886 2 2517 6255 8F No 125 Songjiang Rd Zhongshan Dist Taipei City 104474 Taiwan ...